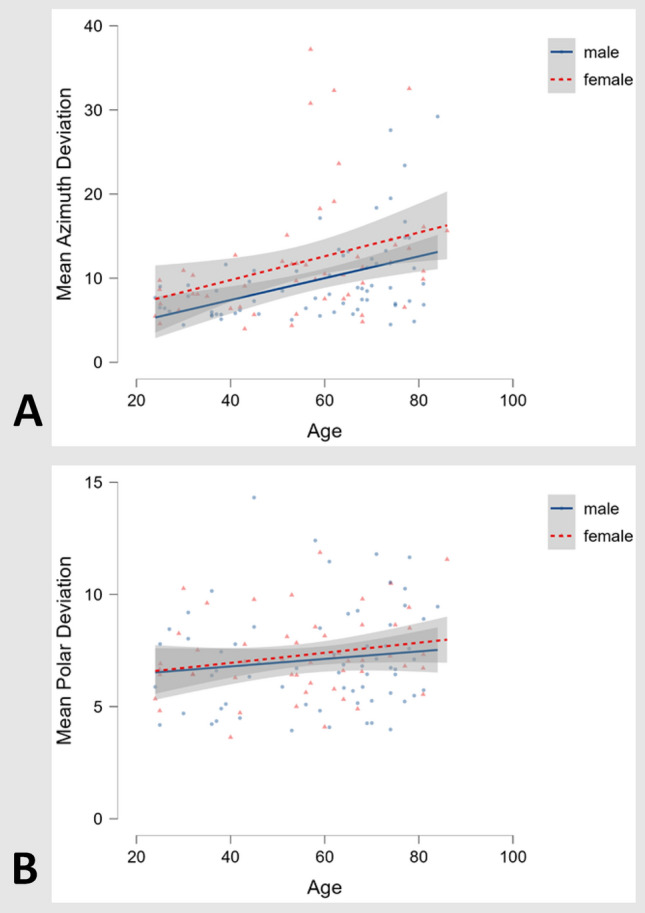
Fig. 3.

3D pointing task: a Plot of mean azimuth deviations (in °, lower scores equaling better performance) against participant age in years for both sexes (male participants: blue line, female participants: red dotted line, n = 121). A decrease of performance with age can be seen in both sexes, while male participants across all ages on average performed slightly better than female participants. b Plot of mean polar against participant age in years for both sexes, showing no clear effect of either age or sex
