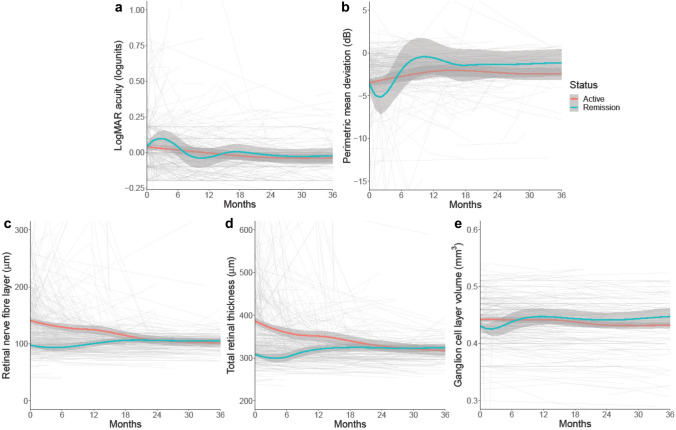
Fig. 3.
Longitudinal visual data from medically managed IIH patients categorised by disease status—active disease (papilloedema present at enrolment) versus ocular remission (no papilloedema at enrolment), and LOESS smoothers added to show trends across the categories. a LogMAR visual acuity (log units). b Perimetric mean deviation measured by Humphrey visual field 24–2 testing (dB). c Retinal nerve fibre layer thickness measured on Optical Coherence Tomography (µm). d Total retinal thickness of optic nerve head measured on Optical Coherence Tomography (µm). e Macular ganglion cell layer volume measured on Optical Coherence Tomography (mm3)

