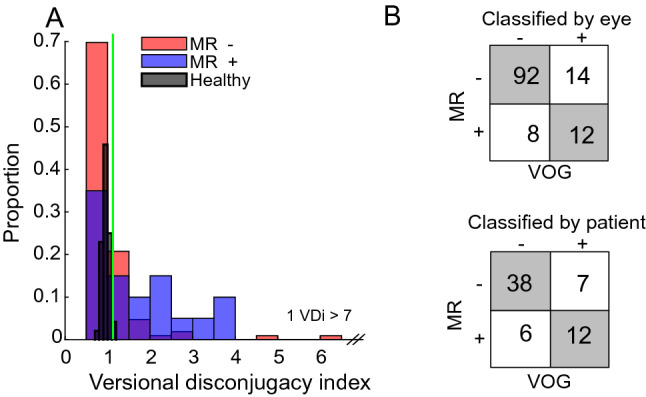
Fig. 1.

VDI probability histograms and contingency tables. A Probability histograms of VDI for normal subjects and MS patients who were either positive or negative for MLF lesions based on MR imaging. The thin green vertical line marks our cut-off (upper 95th percentile of the normal data) for diagnosing INO based on the VDI. Panel B shows the contingency tables for individual eyes and for patients with the frequency distribution of MR ratings to VOR measurements as reference. (Sensitivity 46% by eye, 63% by patient; specificity 92% by eye, 86% by patient)
