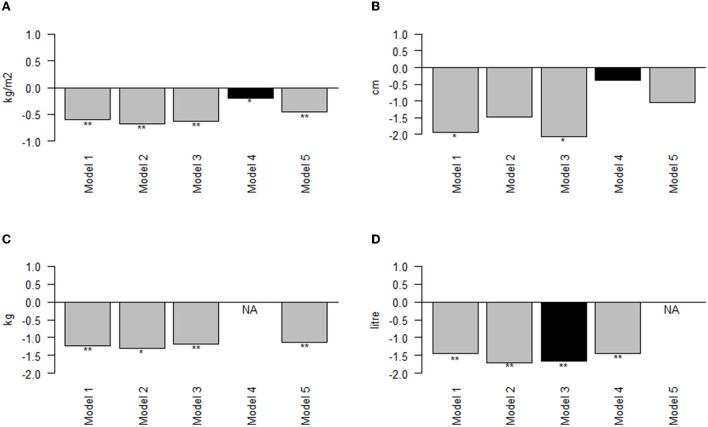
Figure 1.
Effect of adjustments on mean difference in BMI, waist circumference, fat mass and total body water from LORANS. (A) Mean difference in BMI; (B) Mean difference in waist circumference; (C) Mean difference in fat mass; (D) Mean difference in total body water; *: P < 0.05; **: P < 0.001; NA, the model adjusts for the outcome; Black bar, the outcome is highly correlated (r > 0.6) with the variable adjusted for.

