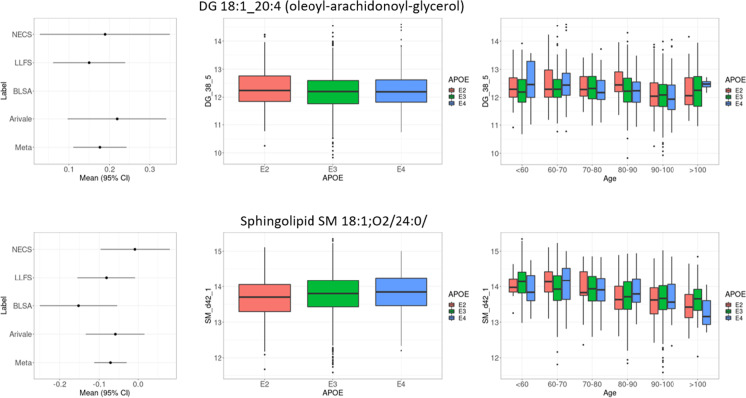
Fig. 1.
Left panel: Forest plot of the study-specific effects of E2 = e2e2, e2e3 vs E3 = e3e3 and meta-analysis results for DG 18:1_20:4 (oleoyl-arachidonoyl-glycerol) and sphingolipid SM 18:1;O2/24:0/. The genetic effects on the x-axis are in log-scale. The panels in the middle and the right display the distribution of the log-transformed levels of these two lipid species by APOE groups and age strata by APOE groups in LLFS participants

