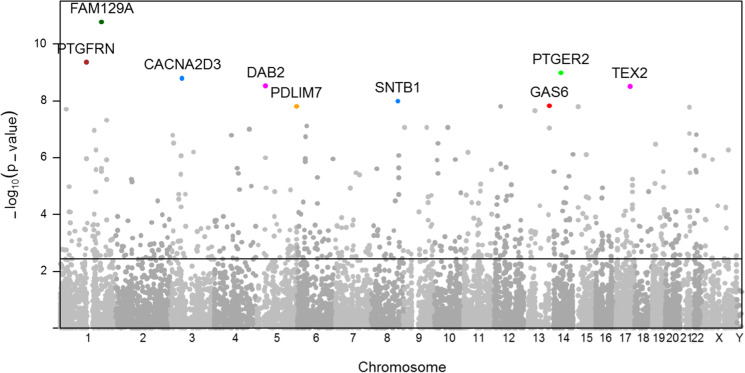
Fig. 2.
Manhattan plot showing the significance of mRNA expression association with comorbidity after adjusting for age, sex, ethnicity, study site, expression/chip, and residual sample contamination with non-monocytes, with the negative logarithm of the association p-values displayed on the Y-axis and transcripts along the X-axis. The dotted line represents the association significance of FDR = 0.05 (N = 708). The top 10 comorbidity-associated transcripts are also included

