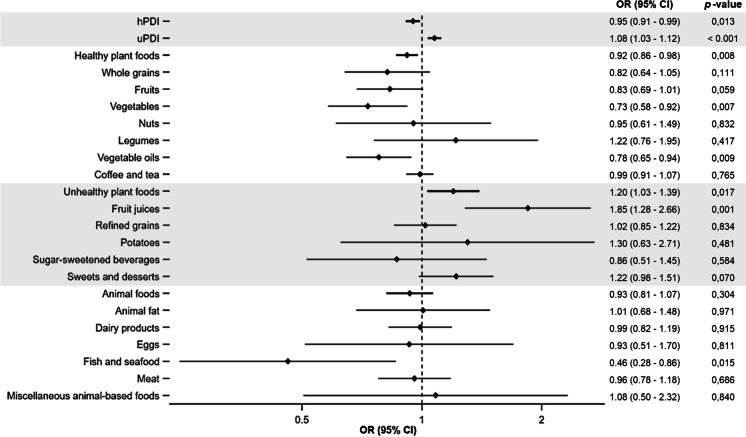
Fig. 1.
Odds ratio (95% CI) for the occurrence of frailty per each Plant-based Diet Index (1-unit increase), each food group, healthy plant food, unhealthy plant food, and animal food, over 3.3 years of follow-up in the Seniors ENRICA-1 cohort participants (N = 1880). Abbreviations: OR odds ratio, CI confidence interval, hPDI healthful Plant-based Diet Index, uPDI unhealthful Plant-based Diet Index. Adjusted for sex, age, educational level (primary, secondary, university), alcohol consumption, smoking status (current, former, never), BMI (< 25, 25–29.9, ≥ 30), energy intake, physical activity, prevalent diseases (type 2 diabetes mellitus, cardiovascular disease [myocardial infarction, stroke, or heart failure], chronic lung disease [asthma or chronic obstructive pulmonary disease], osteomuscular disease [osteoarthritis, rheumatoid arthritis or hip fracture], cancer and depression), number of medicines consumed (0, 1–3, 4–6, > 6)

