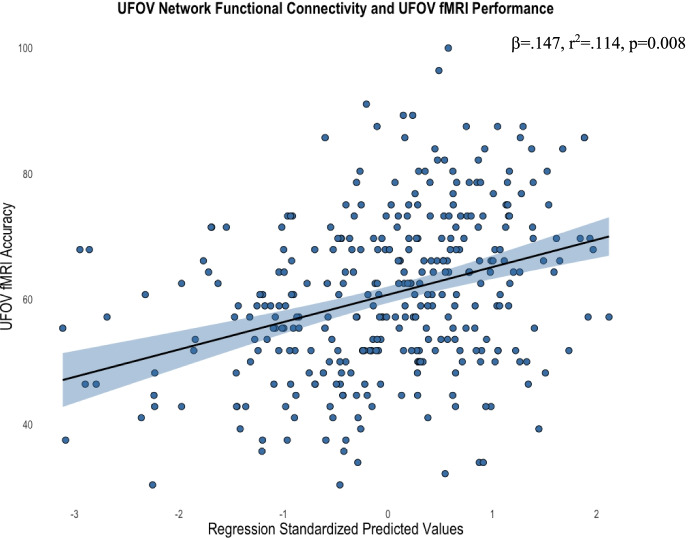
Fig. 6.
Scatterplot depicting the significant relationship between average within-network connectivity of the UFOV network and accuracy on the UFOV fMRI task, controlling for age, sex, years of education, and scanner type (standardized predicted values). Standardized predicted values are calculated by subtracting the mean predicted value of within-network connectivity of the UFOV network (given the mean age, sex, education, and scanner type) from the individual’s predicted value of within-network connectivity of the UFOV network (given an individual’s age, sex, education, and scanner type). This difference is divided by the standard deviation of the predicted values to allow for comparisons between individuals controlling for demographics. Standardized predicted values have a mean of 0 and a standard deviation of 1. Shaded region represents the 95% confidence interval of the regression line

