
Fig. (2).
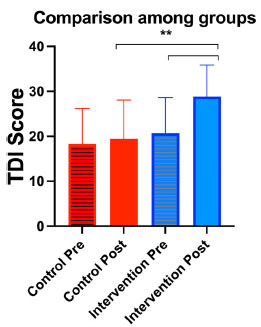
Comparison among groups at the two different observational points. The y axis shows the composite olfactory Threshold, Discrimination, and Identification (TDI) scores of the patients. Standard deviation (SD) is reported. “**” indicates p <0.0001.