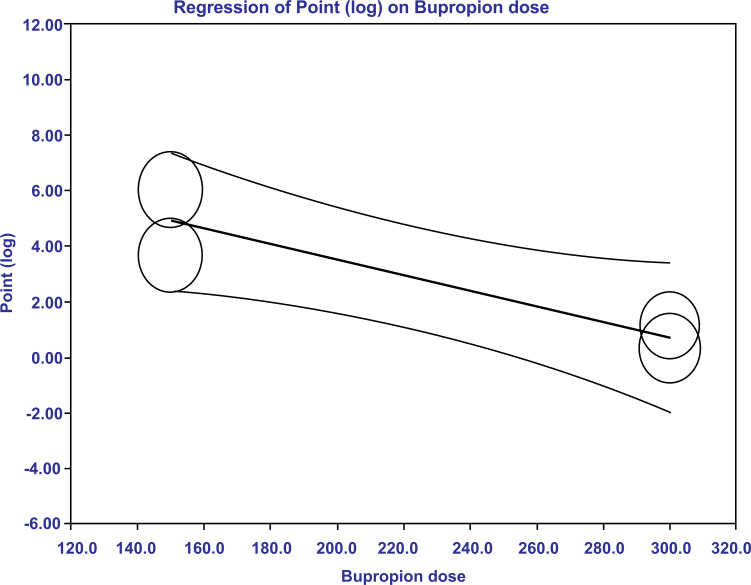
Fig. (3b).
Meta-regression plot (bubble plot) examining the change in estimate effects with changes in bupropion dosage. The regression line of the effect size moves closer to zero when bupropion dose increases. This means that the estimated treatment effects (when adjusted for the other covariates) decrease upon increasing bupropion dose from 150mg to 300mg.

