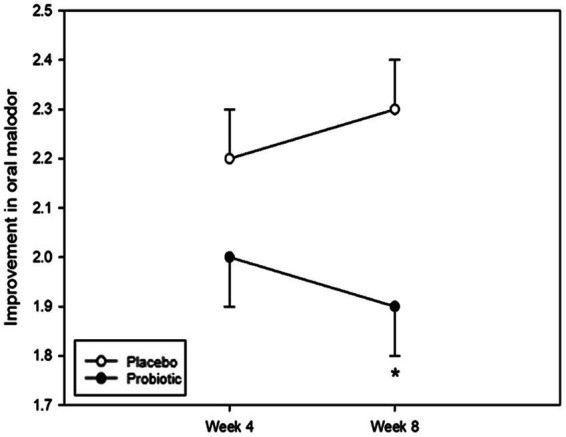
Figure 3.

Analysis of bad breath improvement (BBI) scores. The BBI score was not significantly different between the groups at week 4; however, there was a significant difference at week 8 (p = 0.006). Each line represents the LSmean ± SE. *Value of p ≤ 0.05, Student’s t-test.
