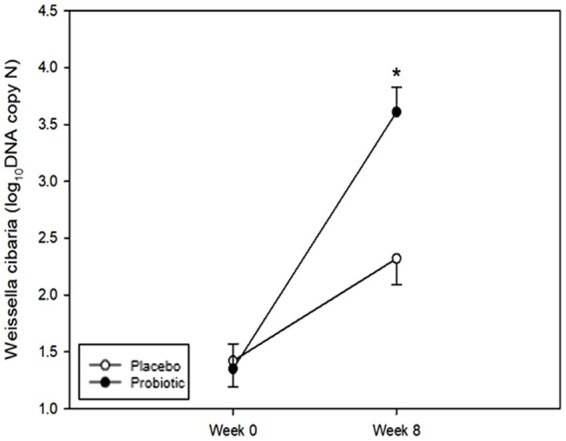
Figure 4.

Changes in Weissella cibaria. The levels of W. cibaria were not significantly different between the groups at week 0 (p = 0.619). The levels of W. cibaria were significantly higher in the probiotic group than in the placebo group at week 8 (p < 0.001). Each line represents the LSmean ± SE. *Value of p ≤ 0.05, Student’s t-test.
