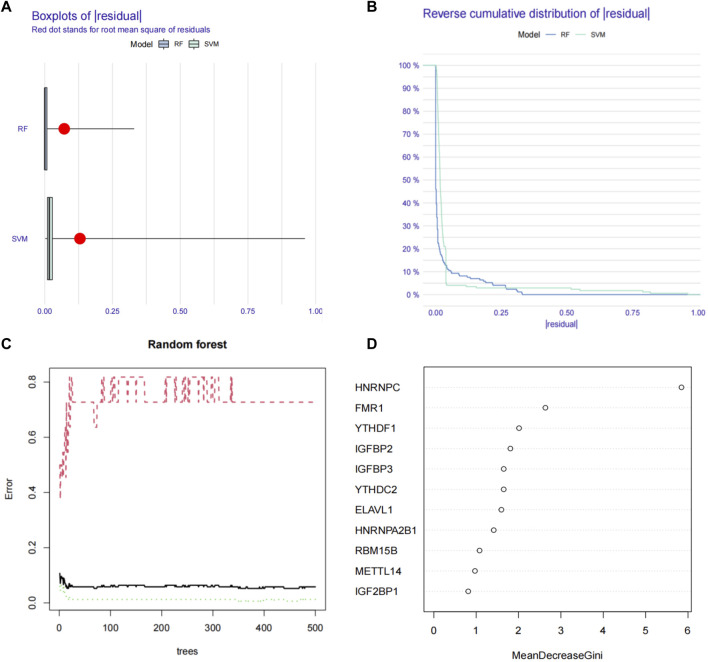
FIGURE 3.
Using machine learning to find ESCC-related m6A regulators in TCGA-ESCA database. (A) Boxplots of residual values of RF (Random Forest) and SVM (Support Vector Machine) models. Red dot represents the mean residual value. (B) Cumulative residual distribution plots of RF (Random Forest) and SVM (Support Vector Machine) models. (C) The error value of the random forest. The red line represents the error of the ESCC group, the green line represents the error of the Normal group, and the black line represents the total sample error. The minimum error point of the three-group cross-validation is is 0.076, corresponding to 18 optimal random forest trees. (D) Mean Decrease Gini score of 11 differentially expressed m6A regulators extracted from TCGA-ESCA database. RF, Random Forest; SVM; Support Vector Machine; m6A, N6-methyladenosine; TCGA, The Cancer Genome Atlas.

