Figure 3.
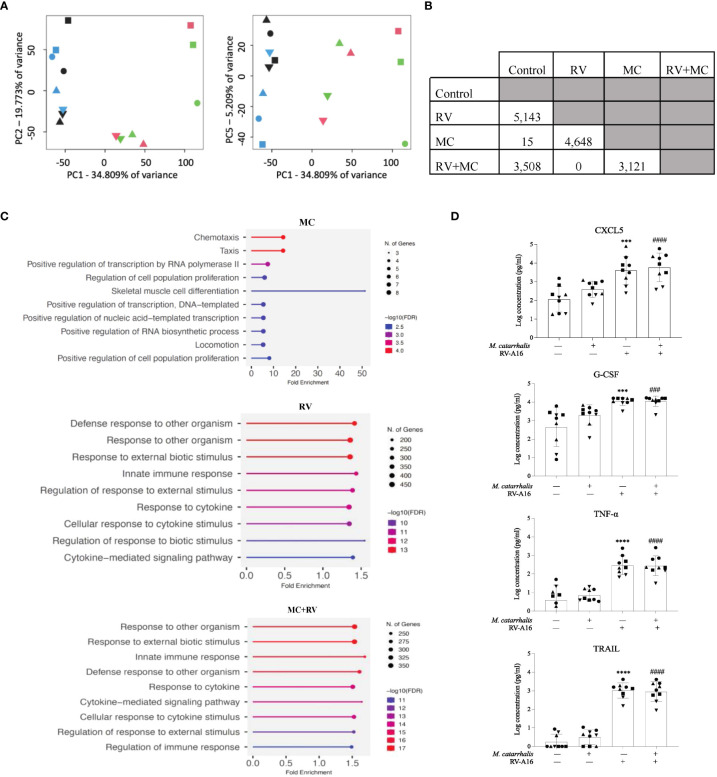
Gene expression and cytokine analyses of ALI cultures infected with RV and M. catarrhalis. ALI cultures from epithelial cell were infected with RV-A16, M. catarrhalis or both as in previous experiments. Principal component analysis of RNA-seq data indicates clustering of samples by treatment. (A) PC1 separates RV treated samples from non-RV treated samples while PC5 separates M. catarrhalis treated from M. catarrhalis untreated samples. The treatment applied to ALI cultures is represented by symbol color: control (blue), RV (green), MC (black), and MC+RV (red). The donors are coded by symbol shape. (B) Differentially expressed genes in ALI cultures from a single epithelial cell donor infected with RV, M. catarrhalis (MC) or both (RV+MC). RNA-seq analysis, conducted using linear regression modeling, indicated differentially expressed genes between each group except between the RV treated and the RV+M. catarrhalis treated samples. For each comparison, the number indicates the number of differentially expressed genes after multiple testing correction per analysis (FDR < 0.05). (C) Gene enrichment analysis of differentially expressed genes following infection with RV, M. catarrhalis (MC) or both (RV+MC) using ShinyGO 0.76 (Ge et al., 2020). The pathways were sorted by -log10 (FDR) values with aunpn FDR cutoff of 0.05. The dotplots show the top 10 enriched pathways for each treatment. (D) Cytokine levels were measured in the medium of ALI cultures infected with RV-A16 and M. catarrhalis. Bars represent geometric mean + SD. #Control vs M. catarrhalis + RV; *Control vs RV; (n = minimum of two per donor; ordinary one-way ANOVA; three symbols P < 0.001, four symbols P < 0.0001).

