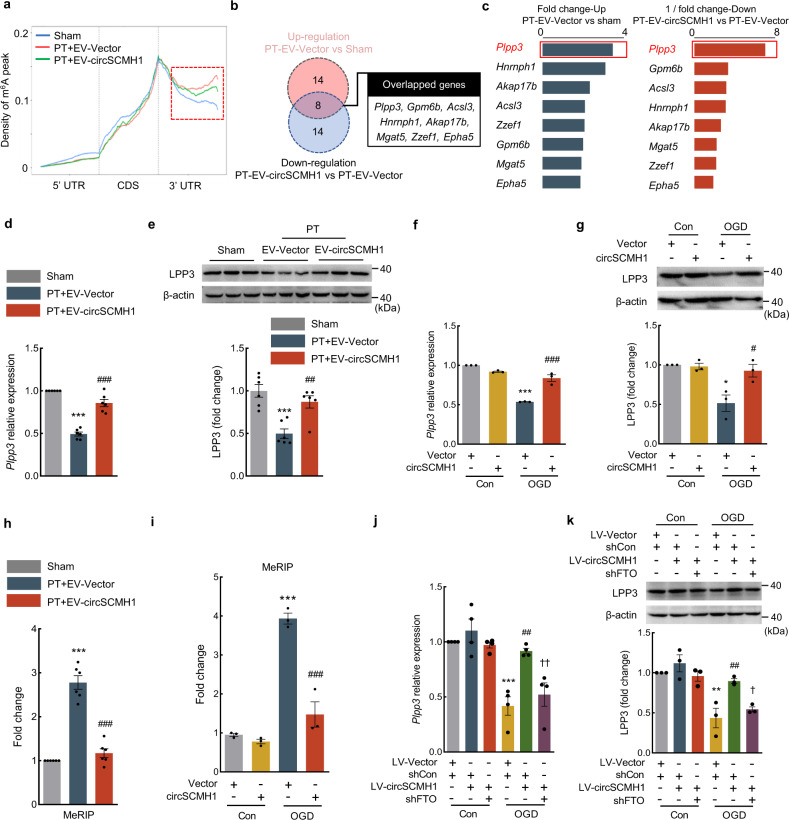
Fig. 5. Plpp3 was one of the critical target genes of circSCMH1-regulated m6A modification in the peri-infarct cortex of PT mice.
a Distribution of m6A peaks across 5′-UTR, CDS, and 3′-UTR of mRNA at day 14 after PT. b Venn diagram showing numbers of genes with significant changes in expression (up: fold change ≥ 2, P < 0.05; down: fold change ≤ 0.5, P < 0.05, rescaled hypergeometric test). c The m6A level of Plpp3 transcript was regulated in PT mice after EV-circSCMH1 administration. d, e Effect of EV-circSCMH1 on Plpp3 mRNA (d) and LPP3 (e) levels in mice at day 14 after PT. n = 6 mice/group. Three representative immunoblots were presented from 6 mice/group. ***P < 0.0001 (d), ***P = 0.0003 (e) versus sham; ##P = 0.0030 (e), ###P < 0.0001 (d) versus PT + EV-Vector. f, g Effect of circSCMH1 plasmid on the expression of Plpp3 mRNA (f) and LPP3 (g) in primary mouse brain microvascular ECs after OGD. Data were presented by three independent experiments. *P = 0.0171 (g), ***P < 0.0001 (f) versus Con + Vector; #P = 0.0375 (g), ###P = 0.0003 (f) versus OGD + Vector. h Specific primers against m6A peak were designed to amplify m6A peak of Plpp3 transcript in RNA from the peri-infarct cortex of mice at day 14 after PT. n = 6/each group. ***P < 0.0001 versus the sham; ###P < 0.0001 versus the PT + EV-Vector. i Specific primers against the m6A peak were designed to amplify the m6A peak of Plpp3 transcript in bEnd.3 cells. Data were presented by three independent experiments. ***P = 0.0002 versus Con + Vector; ###P = 0.0007 versus OGD + Vector. j, k The bEnd.3 cells were transfected with LV-circSCMH1 and shFTO. The Plpp3 mRNA (j) and LPP3 (k) was detected at 12 h after OGD. Data were presented by 4 (j) or 3 (k) independent experiments. **P = 0.0020 (k), ***P = 0.0003 (j) versus Con + LV-Vector + shCon; ##P = 0.0012 (j), ##P = 0.0087 (k) versus OGD + LV-Vector + shCon; †P = 0.0408 (k), ††P = 0.0083 (j) versus OGD + LV-circSCMH1 + shCon. The data in d, e, h, j, k were expressed as mean ± SEM; one-way ANOVA followed by Holm–Sidak post hoc multiple comparison test. The data in f, g, i were expressed as mean ± SEM; two-way ANOVA followed by Bonferroni’s post hoc multiple comparison tests. Source data are provided as a Source Data file. CDS coding region, shRNA short hairpin RNA, 3′ UTR 3′ untranslated regions, 5′ UTR 5′ untranslated regions.

