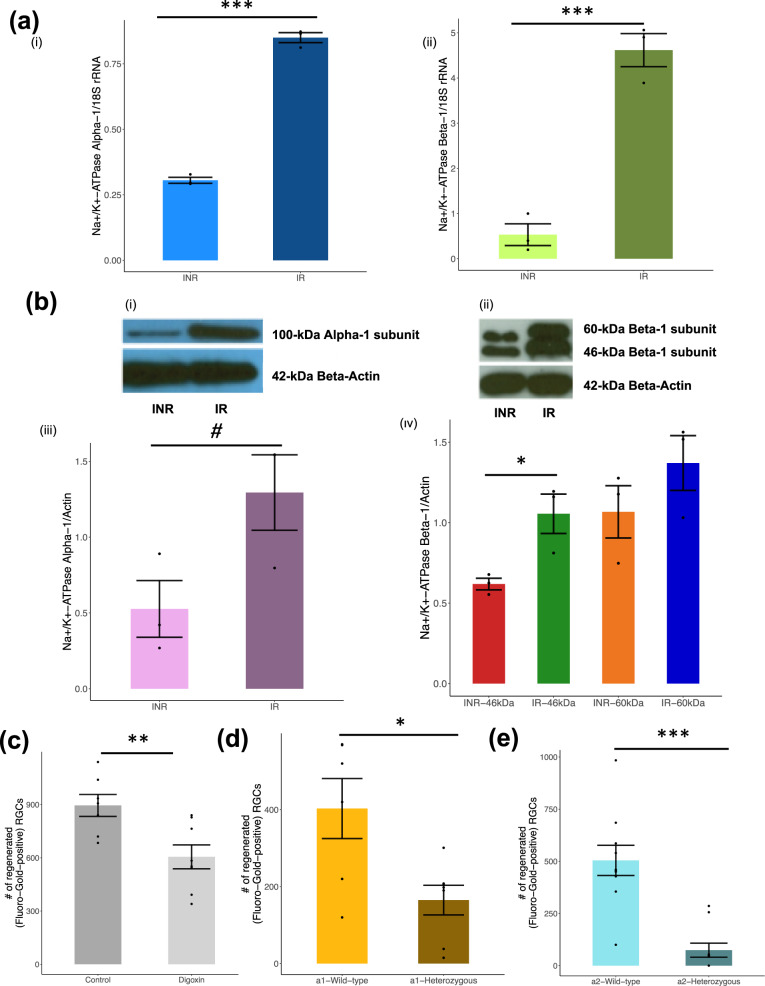
Fig. 7. Regenerated RGCs overexpress Na+/K+-ATPase and show increased pump activity compared to non-regenerated RGCs after injury.
a RT-PCR analyses of injured/non-regenerated (INR) and injured/regenerated (IR) RGCs (N = 3 in each group). Results show Na+/K+-ATPase-α (i) and β (ii) mRNA expression levels relative to 18 S RNA expression levels (y-axis) in INR and IR RGCs (x axis). b Immunoblot analyses of INR and IR RGCs (N = 3 in each group). INR and IR RGCs were lysed and immunoblots of the cell lysates were probed using monoclonal antibodies raised against the α-subunit (i; 100-kDa) and β-subunit (ii; 46-, 60-kDa) of Na+/K+-ATPase, and anti-β-actin (42-kDa, panel below each blot). The protein expression was normalized against β-actin. Quantification of the immunoblots for the α-subunit (iii) and β-subunit (iv) of Na+/K+-ATPase. Full blot images are provided in Supplementary Data 1. c The number of regenerated axons (y axis) amongst the control (N = 7; 895 ± 163) and digoxin-treated (N = 8; 605 ± 190) animals (x axis) are depicted. A significant reduction in the number of regenerating cells was found following digoxin-mediated inhibition of the Na+/K+-ATPase. Values shown are mean ± SEM and all asterisks indicate a P value <0.05 from a Student’s t test. d, e The number of regenerated RGC axons in α1 (c; N = 6) and α2 (d; N = 10) heterozygous knockout mice (y axis) was compared to those in α1 (c; N = 7) and α2 (d; N = 10) wild-type control mice (x axis). Values shown are mean ± SEM and all asterisks indicate a P value <0.05 from a Student’s t test. Figure 1c and Video 1 show a representative image (×20) of retina flat mount with the fluorescent (Fluorogold-positive) RGCs that regenerated axons to the end of the graft. The fluorescent cells are counted under fluorescent microscopy to generate the data in c–e.

