Fig. 3.
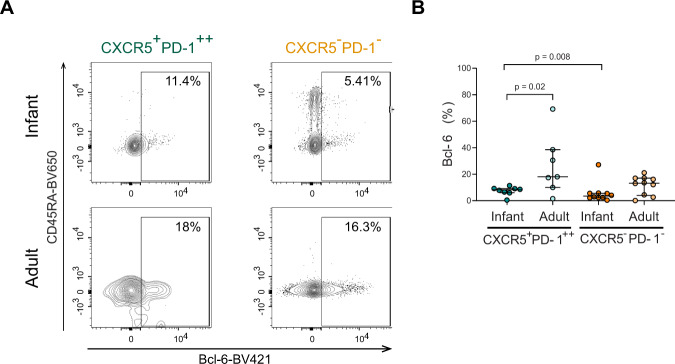
Infant intestinal CXCR5+PD-1++ CD4+ T cells have a TFH phenotype. A Representative flow cytometric plots of the expression levels of Bcl-6 in CXCR5+PD-1++ CD4+ T cells and CXCR5−PD−1−CD4+ T cells in infant and adult intestines. B Frequencies (%) of Bcl-6 expressing intestinal CXCR5+PD-1++ cells (green) and CXCR5−PD-1− CD4+ T cells (orange) in infants and adults. (Infant CXCR5+PD-1++ % n = 8; infant CXCR5−PD-1− % n = 10; adult CXCR5+PD-1++ % n = 7; adult CXCR5−PD-1− % n = 10). Medians and IQRs are depicted in all figures. Mann–Whitney test was used to compare infant and adult samples, and Wilcoxon matched-pairs signed ranked test was used to compare CXCR5+PD-1++ and CXCR5−PD-1− CD4+ T cells. Only significant p values are shown

