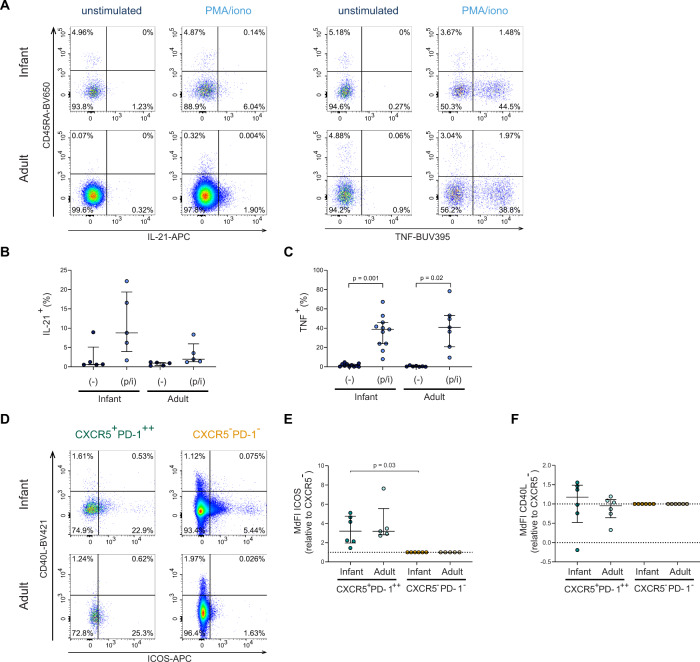
Fig. 5.
Infant intestinal CD4+ T cells produce IL-21 and TNF. A Representative flow cytometric plots of viable infant and adult intestinal CD4+ T cells (CD4+ CD3+, unstimulated; CD3+CD8-, PMA/ionomycin-stimulated) lamina propria-derived lymphocytes showing IL-21 and TNF expression. B Frequencies (%) of infant and adult IL-21+ CD4+ T cells in unstimulated (−) and stimulated (p/i) conditions. C Frequencies (%) of infant and adult TNF+ CD4+ T cells in unstimulated (-) and stimulated (p/i) conditions. D Representative flow cytometry plots showing ICOS expression and CD40L expression on CXCR5+PD-1++ CD4+ T cells (green) and CXCR5−PD-1− CD4+ T cells (orange) in infant and adult intestines. E ICOS expression of CXCR5+PD-1++ CD4+ T cells relative to the sample corresponding CXCR5−PD-1− CD4+ T cells. F CD40L expression of CXCR5+PD-1++ CD4+ T cells relative to the sample corresponding CXCR5−PD-1− CD4+ T cells. Medians and IQRs are depicted in all figures. (For B infant n = 5; adult n = 5. For C infant n = 11; adult n = 7. For E infant n = 6; adult n = 5. For F infant n = 6; adult n = 6). Wilcoxon matched-pairs signed rank test was used to compare unstimulated/stimulated samples, Mann-Whitney test was used to compare cytokine productions by infant and adult cells; and Wilcoxon signed rank test was used to compare ICOS and CD40L expression by CXCR5+PD−1++ and CXCR5−PD-1− CD4+ T cells. Only significant p values are shown

