Fig. 7.
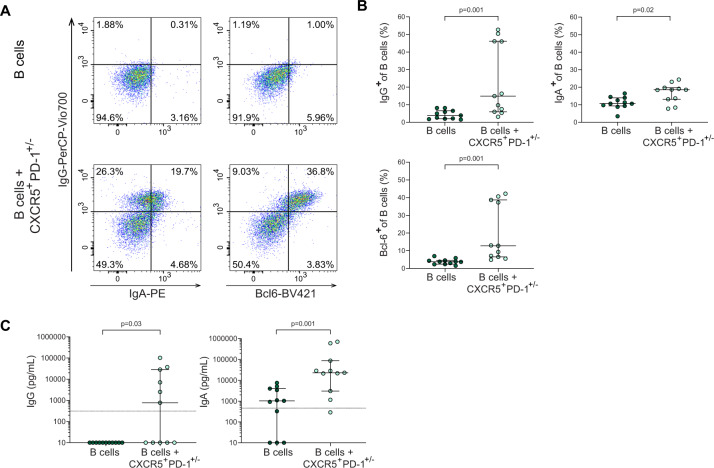
Infant intestinal CXCR5+PD-1+/− CD4+ T cells promote infant intestinal B cell maturation. A Representative flow cytometric plots of B cell analyses of B cell cultures alone or upon co-culture with CXCR5+PD-1+/− CD4+ T cells (lower plots), showing IgG, IgA and Bcl-6 expressions. B Frequencies (%) of IgG+ (top left), IgA+ (top right) and Bcl-6+ (bottom) in B cells cultured alone and in co-culture with autologous CXCR5+PD-1+/− cells. C Levels of IgG (left) and IgA (right) present in culture supernatants of B cells cultured alone and in co-culture with CXCR5+PD-1+/− cells measured by ELISA. Limit of detection for each ELISA experiment is depicted with a horizontal line in the plot. Medians and IQRs are depicted in all figures. N = 5 intestinal samples. For 3 of the donors, 3 replicates were performed. Each dot represents one donor/replicate. Wilcoxon matched-pairs signed rank test was used for comparisons. Only significant p values are shown

