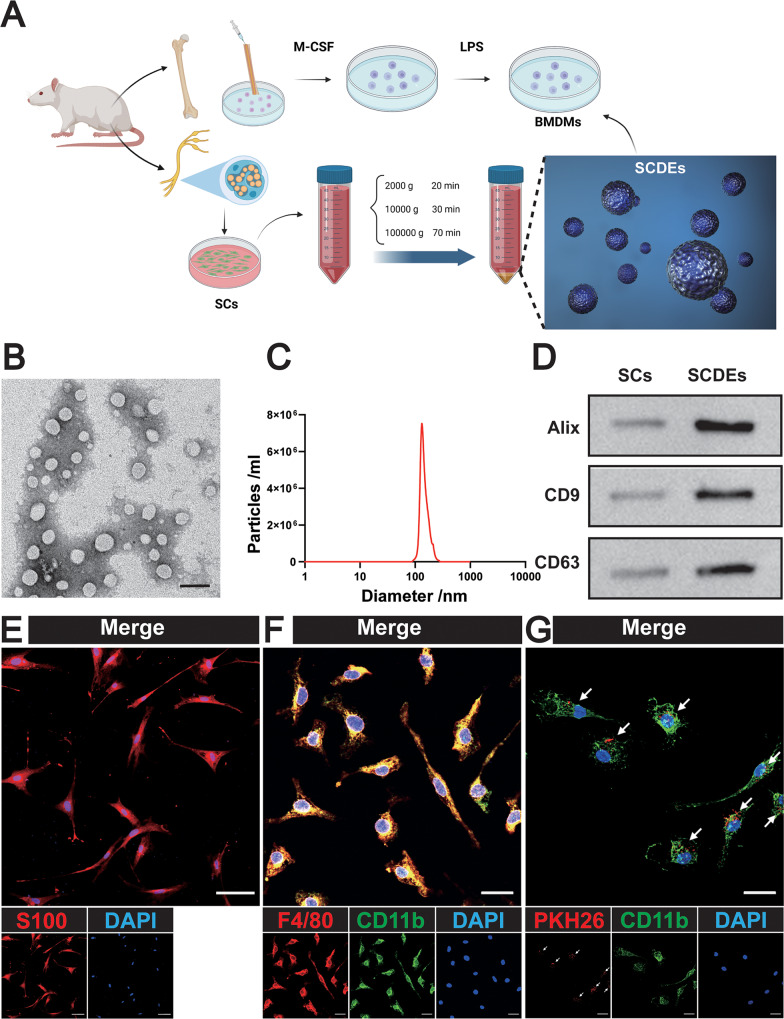
Fig. 1. Identification and uptake of SCDEs.
A Schematic diagram of BMDMs and SCDEs. B Morphology of SCDEs under TEM. Scale bars: 100 nm. C The diameter distribution of SCDEs. D Western blot analysis of the positive expression of Alix, CD9, and CD63 in SCDEs. E Representative images of S100 (red). Nuclei were labeled with DAPI (blue). Scale bars: 20 µm. F Representative images of F4/80 (red) and CD11b (green). Nuclei were labeled with DAPI (blue). Scale bars: 20 µm. G Representative images of PKH26 (red)-labeled SCDEs absorbed by BMDMs. Nuclei were labeled with DAPI (blue). Scale bars: 20 µm.

