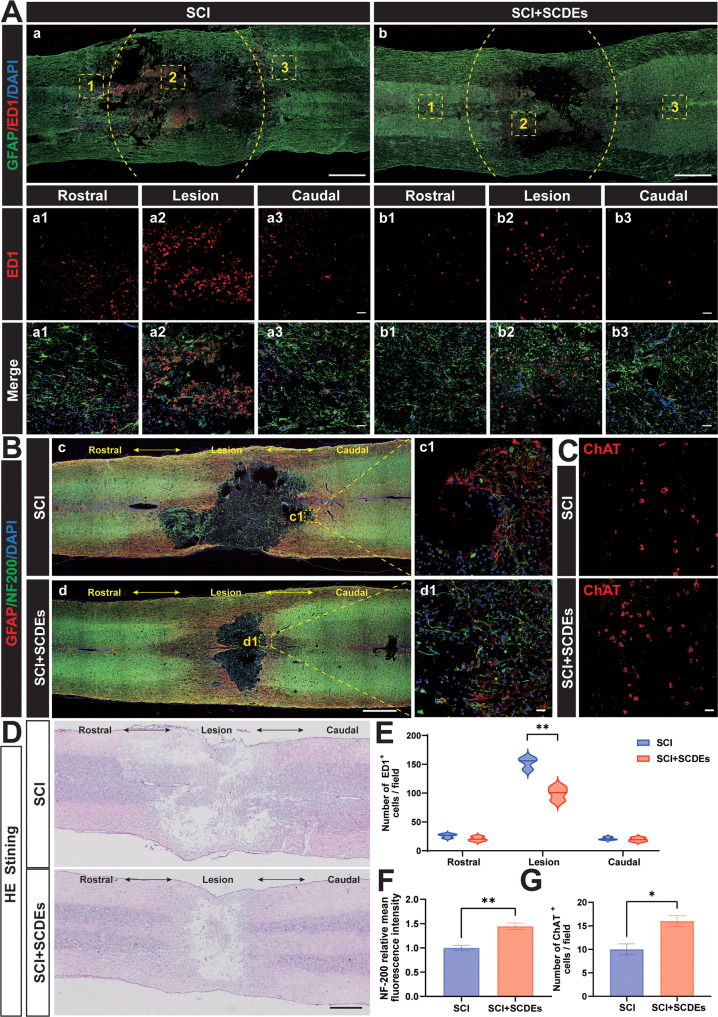
Fig. 4. SCDEs improved spinal cord repair after SCI in vivo.
A Representative images of immunofluorescence staining of ED1 (red) and GFAP (green) in each group at day 3 after SCI (n = 3). Scale bars: 1000 µm. The bottom row of images were high-resolution versions of the boxed regions in the top row of images. Scale bars: 50 µm. B Representative images of immunofluorescence staining of GFAP (red) and NF-200(green) in each group at day 14 after SCI (n = 3). Scale bars: 1000 µm. The right images were high-resolution versions of the boxed regions in the left images. Scale bars: 20 µm. C Representative images of immunofluorescence staining of ChAT(red) in the SCI group and SCI + SCDEs group (n = 3). Scale bars: 20 µm. D The H&E staining of the spinal cord showed the reduction of the damaged area in the SCI rat treated with SCDEs. E Quantitative analysis of the number of ED1 + cells, showing that being treated with SCDEs can reduce the number of ED1 + cells in the rostral, lesion, and caudal. F Quantitative analysis of the relative mean intensity of the fluorescence of NF200. G Quantitative analysis of the number of ChAT+ cells, showing that the number of ChAT+ cells in the SCI rat treated with SCDEs was higher. Data were presented as mean ± SEM. Results were analyzed by Student’s t-test. Significance: *P < 0.05, **P < 0.01.

