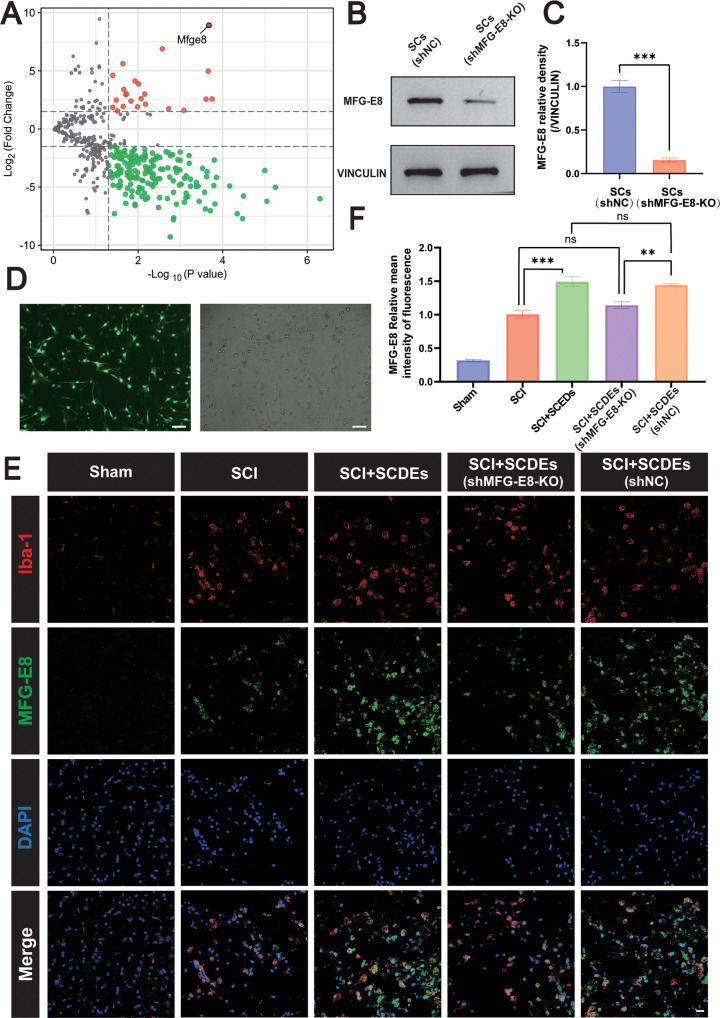
Fig. 6. MFG-E8 was the key component of SCDEs in the regulation of inflammatory responses.
A The differentially expressed proteins between SCDEs and SCs were analyzed by proteomics, and the up-regulated or down-regulated proteins of SCDEs were screened and compared with SCs. B Representative western blots showing the knockout of MFG-E8 in the SCs (shNC) and SCs (shMFG-E8-KO) group. C Quantitative analysis of the MFG-E8/VINCULIN ratio in the SCs (shNC) and SCs (shMFG-E8-KO) group (n = 3). D Representative fluorescence images of SCs (green) after the MFG-E8 gene was knocked out. Scale bar: 100 μm. E Representative immunofluorescence staining images of Iba-1 (red) and MFG-E8 (green). Nuclei were labeled with DAPI (blue) in each group (n = 5). Scale bar: 20 μm. F The image analysis results were presented as the relative mean intensity of the fluorescence of MFG-E8. Data were presented as mean ± SEM. Results were analyzed by Student’s t-test and One-way ANOVA. Significance: **P < 0.01, ***P < 0.001.

