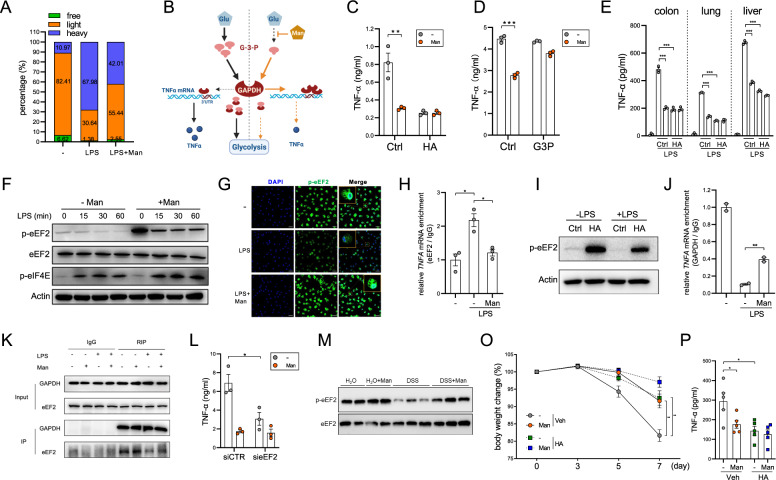
Fig. 5.
Mannose suppresses TNF-α translation by enhancing GAPDH binding to TNF-α mRNA. Peritoneal macrophages were treated with 1 μg/ml LPS in the presence or absence of mannose for 6 h. A Polysome profiling was performed. The relative abundances of free ribosomes, light ribosomes, and heavy ribosomes were determined. B Schematic showing the competitive binding of G3P and TNF-α mRNA to GAPDH. C, D Peritoneal macrophages were stimulated with 1 μg/ml LPS for 12 h in the presence or absence of HA (C) or exogenous G3P (D), and TNF-α production was evaluated by ELISA. E Macrophages were isolated magnetically from the colon, lung and liver of mice and were then stimulated with 1 μg/ml LPS for 12 h. TNF-α production was evaluated by ELISA. F Peritoneal macrophages were stimulated with 1 μg/ml LPS for different times, and the levels of the indicated proteins were evaluated by immunoblotting. G The level of p-eEF2 was evaluated by immunofluorescence staining 1 h after stimulation with 1 μg/ml LPS. H Peritoneal macrophages were stimulated with 1 μg/ml LPS for 1 h, and the amount of eEF2-bound TNF-α mRNA was evaluated by a RIP assay. I Peritoneal macrophages were stimulated with 1 μg/ml LPS in the presence or absence of HA for 30 min, and the level of p-eEF2 was evaluated by immunoblotting. J Peritoneal macrophages were stimulated with 1 μg/ml LPS for 1 h, and the amount of GAPDH-bound TNF-α mRNA was evaluated by a RIP assay. K The interaction between GAPDH and eEF2 was evaluated by CoIP. L Peritoneal macrophages were transfected with eEF2 siRNA for 48 h and stimulated with 1 μg/ml LPS, and TNF-α production was evaluated by ELISA. M Colonic macrophages were isolated from healthy or colitic mice, and the p-eEF2 level was evaluated by immunoblotting. O, P Mice were fed 2.5% DSS with or without intraperitoneal administration of HA (n = 5/group). Body weight was measured (O), and TNF-α production in colon tissues was evaluated by ELISA (P). The data are presented as the means ± SEMs. *p < 0.05; **p < 0.01; ***p < 0.001; two-tailed unpaired Student’s t test

