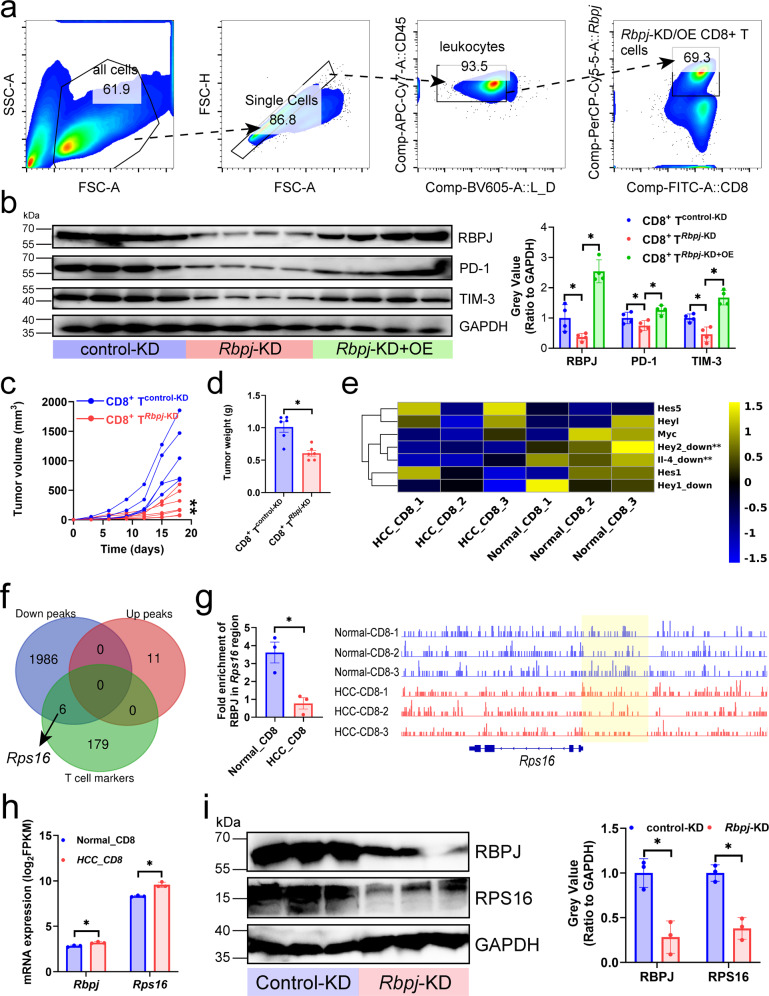
Fig. 2. Inhibition of Rbpj in CD8+ T cells alleviated CD8+ T cell exhaustion.
a Gating strategy. Mouse HCC infiltrating CD8+ T cells were purified by magnetic beads, and CD8+ T cells with overexpression or knockdown of Rbpj were obtained by flow cytometry. b Effect of knockdown and overexpression of Rbpj in CD8+ T cells (CD8+ TRbpj-KD/CD8+ TRbpj-KD+OE) on inhibitory receptor expression in mouse HCC infiltrating CD8+ T cells (n = 4). c, d Growth curves (c) and weight plot (d) showing the effects of CD8+ TRbpj-KD/CD8+ TRbpj-KD+OE on the growth of the subcutaneous tumors (n = 6). e mRNA expression of the target genes of the Notch signaling pathway in mouse normal liver and HCC-infiltrating CD8+ T cells (n = 3). f Venn diagram showing the intersection of T cell-related genes, derived from the CellMarker database (http://xteam.xbio.top/CellMarker/), and the genes to which RBPJ enriched peaks belong (n = 3). Enrichment peaks with P-value < 0.05 and |log2(fold change)| > 1. g Rps16 locus with normalized CUT&Tag signals for mouse normal liver and HCC-infiltrating CD8+ T cells (n = 3). Yellow highlighting calls attention to peaks that differ most strikingly between two groups. h mRNA expression of Rbpj and Rps16 in mouse normal liver and HCC-infiltrating CD8+ T cells (n = 3). i CD8+ TRbpj-KD inhibited the protein expression of RPS16 in mouse HCC infiltrating CD8+ T cells (n = 3). Mean ± SD. Statistical significance determined by paired two-tailed t-test (b–e, g–i). *P < 0.05; **P < 0.01.

