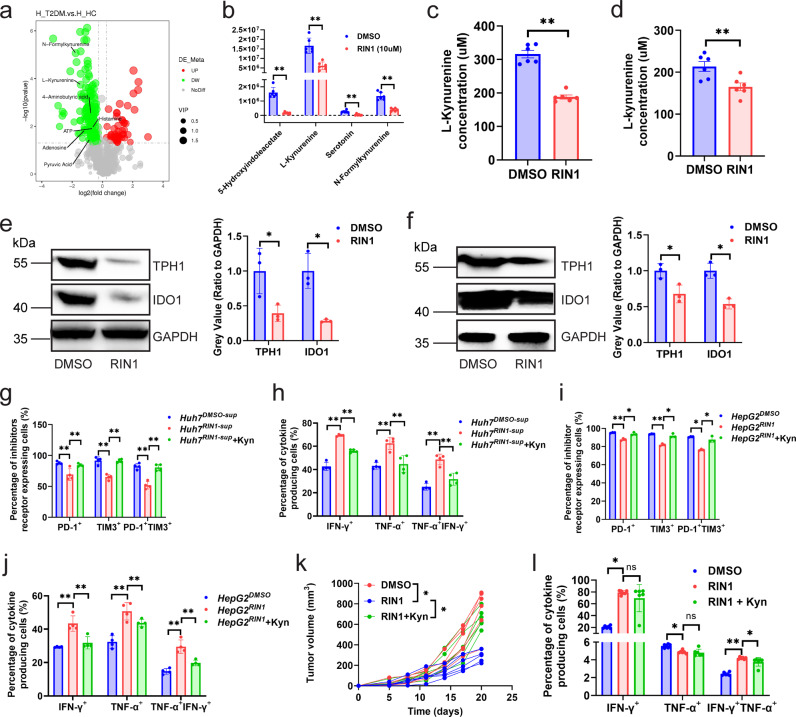
Fig. 5. RIN1 improved CD8+ T cell function by inhibiting tryptophan metabolism.
a Volcano plot of metabolome from Huh7 cells treated with DMSO and RIN1 (10 μM) (n = 3). Metabolites that were elevated in RIN1-treated cells (Padj < 0.05 and log2(fold change) > 1) were marked in red, while decreased (Padj < 0.05 and log2(fold change) < −1) were marked in blue. Selected metabolites were labeled. b Boxplots demonstrating the abundance of L-kynurenine, N-formylkynurenine, 4-aminobutyric acid, and serotonin in Huh7 cells (n = 6). c, d ELISA analysis of L-kynurenine secretion by Huh7 (c) and HepG2 (d) cells (n = 6). e, f Immunoblot showing the protein expression of TPH-1 and IDO1 in Huh7 (e) and HepG2 (f) cells (n = 3). g-j Inhibitory receptor (g, i) and cytokine (h, j) expression on patient HCC infiltrating CD8+ T cells from control, HCCRIN1-sup, and HCCRIN1-sup with L-kynurenine (200 nM) groups, HCCRIN1-sup included Huh7RIN1-sup (g, h) and HepG2RIN1-sup (i, j) (n = 4). k, l Tumor growth curves (k) and cytokine expression on CD8+ T cells in tumors (l) from control, intraperitoneal injection of RIN1 (50 mg/kg), and intraperitoneal injection of RIN1 with L-kynurenine (30 mg/kg) groups (n = 6). Mean ± SD. Statistical significance determined by paired two-tailed t-test (a–l). *P < 0.05; **P < 0.01.

