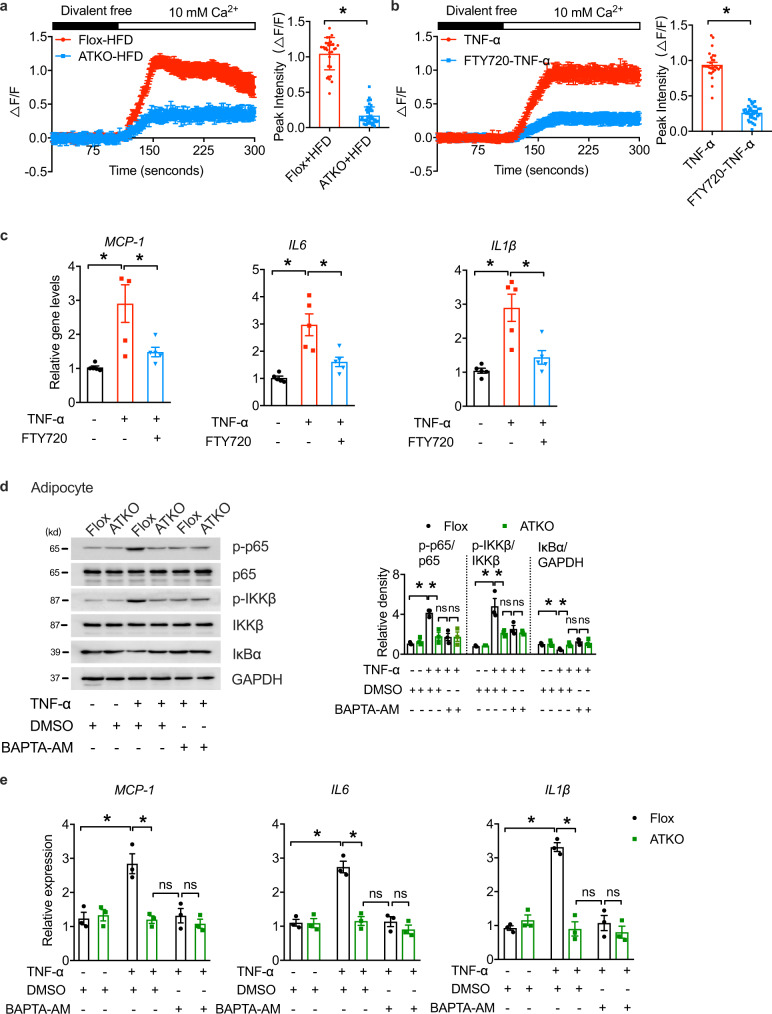
Fig. 4. Ca2+ elevations are responsible for TRPM7-dependent adipocyte inflammation.
a Relative changes in the fluorescence of Fluo-4-loaded mature adipocytes isolated from eWAT of Flox and ATKO mice fed with HFD, reflecting changes in intracellular Ca2+ concentration ([Ca2+]i). Bar chart showed the quantification of peak [Ca2+]i. These represent typical results from three independent experiments (n = 30 cells for Flox-HFD, n = 45 cells for ATKO-HFD, from 3 mice). b Relative changes in [Ca2+]i over time in mature adipocyte pretreated with FTY720 (5 μM) for 15 min, followed by stimulation with TNF-α (60 ng/ml) for 15 min as indicated. Bar chart showed the quantification of peak [Ca2+]i. Results are a compilation of three experiments (n = 27 cells for TNF-α, n = 38 cells for FTY720-TNF-α, from 3 different experiments). c qPCR analysis of indicated gene expression of MCP-1, IL6, and IL1β in differentiated adipocytes treated as depicted. Adipocytes were treated with TNF-α (40 ng/ml; 12 h) with FTY720 (5 μM; 15 min) pretreatment (n = 5 biologically independent experiments). d Western blots of phosphorylated and total p65, IKKβ, IκBα and GAPDH in cultured primary adipocytes from eWAT of Flox and ATKO mice. Prior to TNF-α treatment (60 ng/ml; 15 min), adipocytes were pretreated with DMSO or BAPTA-AM (10 μM) for 30 min in serum-free media (n = 3 biologically independent experiments). e Relative mRNA expression of indicated inflammatory genes in cultured primary adipocytes from Flox and ATKO mice. Cells were treated with BAPTA-AM (10 μM; 30 min) or DMSO as indicated prior to TNF-α treatment (60 ng/ml; 15 min) (n = 3 biologically independent experiments). Statistical data were assessed using two-tailed Student’s t test (a, b) or one-way ANOVA statistical analysis (c–e) and are presented as mean ± SEM. *p < 0.05. Source data are provided as a Source Data file. kd, relative molecular weight in kilodalton.

