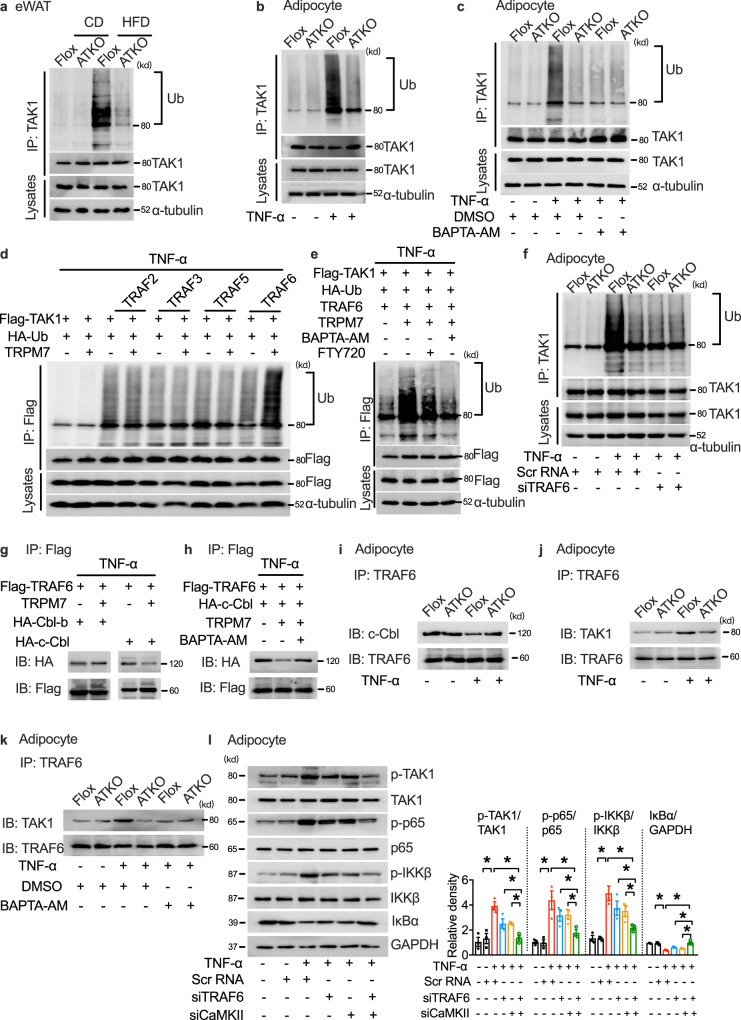
Fig. 6. E3 ligase TRAF6 functions as co-regulator of CaMKII in TRPM7-induced TAK1 activation.
a Ubiquitination level of TAK1 in eWAT of Flox and ATKO mice in the presence or absence of HFD for 16 weeks (n = 3 mice). b The ubiquitination of TAK1 in TNF-α (60 ng/ml; 30 min)-stimulated adipocytes. c Immunoprecipitation (IP) analysis of TAK1 ubiquitination in cultured primary adipocytes pretreated with BAPTA-AM (10 μM; 30 min) and followed by TNF-α (60 ng/ml; 30 min). d IP and western blot of indicated proteins in HEK293T cells transfected with Flag-TAK1, HA-Ub and the indicated E3 ubiquitin ligases in the presence or absence of TRPM7 in the treatment of TNF-α (60 ng/ml; 30 min). e IP and western blot of indicated proteins in HEK293T cells transfected with Flag-TAK1, HA-Ub, TRAF6 and TRPM7 in response to either BAPTA-AM (10 μM; 30 min) or FTY720 (5 μM; 15 min) stimulation followed by TNF-α treatment (60 ng/ml; 30 min). f The level of TAK1 ubiquitination in cultured primary adipocytes transfected with TRAF6 siRNA upon TNF-α challenge (60 ng/ml; 30 min). g IB or IP lysates from HEK293T cells transfected with various plasmids as indicated. h Interaction of TRAF6 with c-Cbl in HEK293T cells transfected with Flag-tagged TRAF6 and HA-tagged c-Cbl in the presence or absence of TRPM7 or BAPTA-AM (10 μM; 30 min) prior to TNF-α treatment (60 ng/ml; 30 min). i Endogenous interaction of TRAF6 with c-Cbl in TNF-α (60 ng/ml; 30 min)-treated adipocytes. j Endogenous interaction of TRAF6 with TAK1 in TNF-α (60 ng/ml; 30 min)-treated adipocytes. k Co-immunoprecipitation of TRAF6 with TAK1 in cultured primary adipocytes in response to TNF-α (60 ng/ml; 30 min). l The level of key proteins of the NF-κB signaling cascade in TRAF6 siRNA, CaMKII siRNA or scramble siRNA transfected differentiated 3T3-L1 adipocytes followed by TNF-α treatment (60 ng/ml; 15 min). n = 3 biologically independent experiments for (a–l). Statistical data in (l) was assessed using one-way ANOVA and are presented as mean ± SEM. *p < 0.05. Source data are provided as a Source Data file. kd, relative molecular weight in kilodalton.

