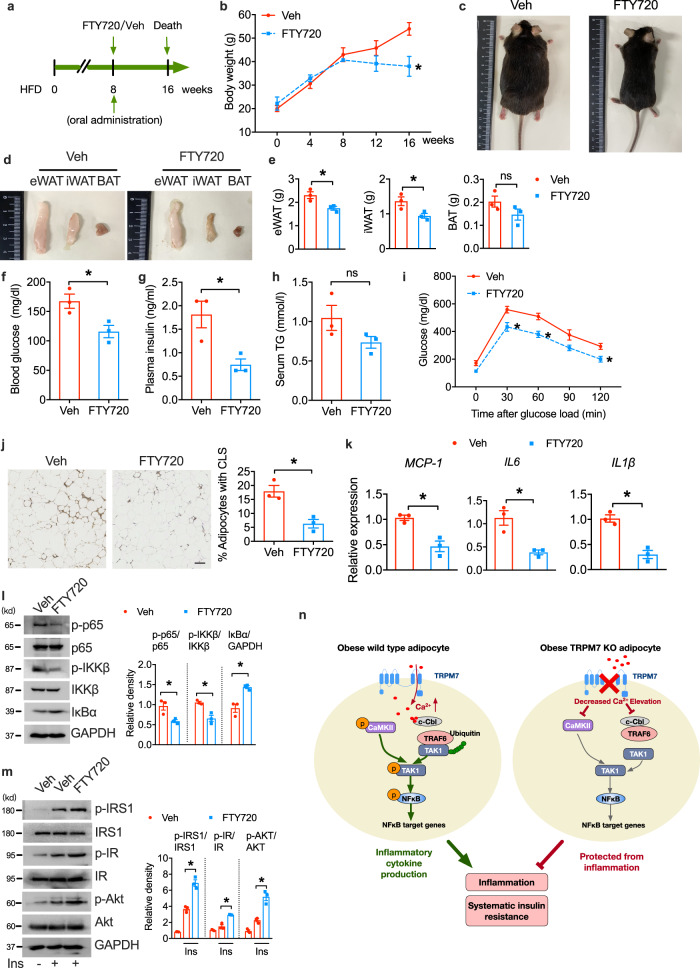
Fig. 8. Effects of oral FTY720 on obese mice.
a Schematic representation of experimental scheme for FTY720 oral administration. b Body weight on HFD (n = 3 mice). c Representative photographs of vehicle and FTY720-treated mice fed with CD or HFD (n = 3 mice). d, e Representative images (d) and fat mass weight (e) of eWAT, iWAT and BAT (n = 3 mice). f–h Serum glucose (f), insulin (g) and triglycerides (h) levels in overnight-fasted mice fed with HFD (n = 3 mice). i Glucose tolerance test in FTY720-treated and veh-treated mice fed with HFD (n = 3 mice). j Representative paraffin sections of eWAT stained for F4/80. Bar indicates 100 μm. Bar chart showing density of CLS (n = 3 mice). k Pro-inflammatory gene (mRNA) expression in eWAT (n = 3 mice). l eWAT were lysed for immunoblotting with the indicated antibodies (n = 3 mice). m Immunoblot analyses of eWAT samples using antibodies against the indicated protein (n = 3 mice). n Schematic summary of the role of adipocyte TRPM7 in obesity-induced alterations in adipose inflammation and insulin resistance. Statistical data were assessed using two-tailed Student’s t test (b, e–l) or one-way ANOVA statistical analysis (m) and are presented as mean ± SEM. *p < 0.05. Source data are provided as a Source Data file. kd, relative molecular weight in kilodalton; ns, not significant; veh, vehicle.

