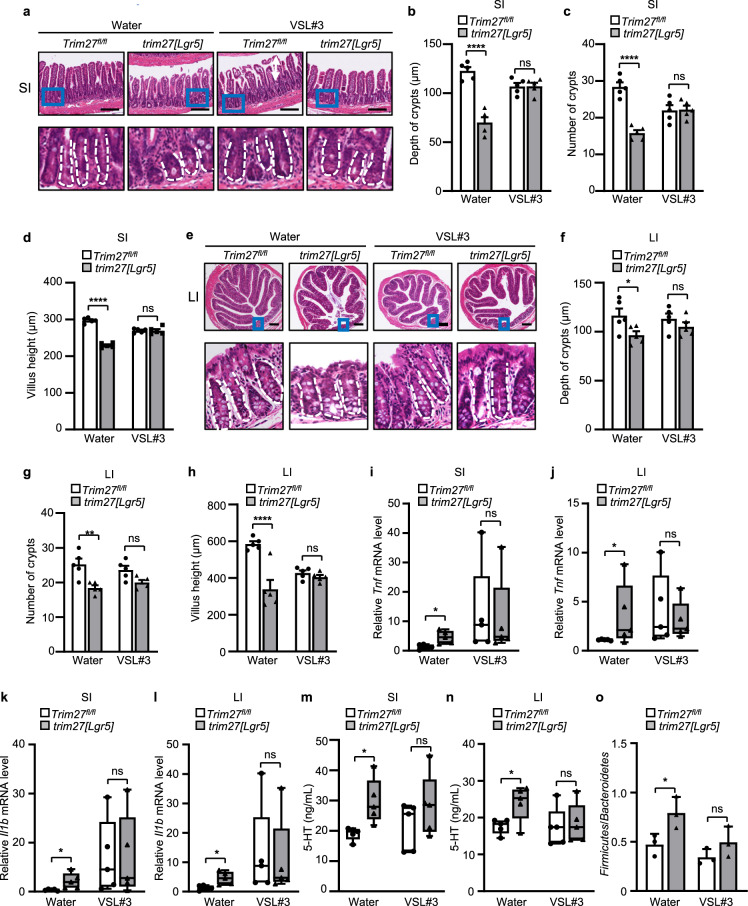
Fig. 8.
Probiotic supplementation alleviates TRIM27 deficiency-induced IBS symptoms. a H&E staining of the SI from 16-week-old Trim27fl/fl and trim27[Lgr5] mice fed VSL#3 daily. Bottom, enlarged images of the regions outlined in the upper panels. Scale bars, 300 μm. The white dashed lines mark crypt borders. b–d Crypt depth (b), crypt number per mm (c) and villus height (d) in the SI from mice as described in a. At least 20 randomly selected crypts (b, d) or randomly selected fields (c) from the SI of each mouse were analyzed, and the average was calculated. Five mice per group were analyzed. e H&E staining of the LI from 16-week-old Trim27fl/fl and trim27[Lgr5] mice fed VSL#3 daily. Bottom, enlarged images of the regions outlined in the upper panels. Scale bars, 300 μm. The white dashed lines mark crypt borders. f–h Crypt depth (f), crypt number per mm (g) and villus height (h) in the LI from mice as described in e. At least 20 randomly selected crypts (f, h) or randomly selected fields (g) from the LI of each mouse were analyzed, and the average was calculated. Five mice per group were analyzed. i, j qPCR analysis of Tnf mRNA expression in the SI (i) and LI (j) from mice as described in a. k, l qPCR analysis of Il1b mRNA expression in the SI (k) and LI (l) from mice as described in a. m, n ELISA of 5-HT in the SI (m) and LI (n) from mice as described in a. o The ratio of Firmicutes to Bacteroidetes in the colonic contents from mice as described in a. In b–d and f–o, statistical analyses were performed using two-way ANOVA with Sidak’s multiple comparisons test. The data are presented as the means ± SEMs (b–d and f–h, n = 5; o, n = 3) or in box-and-whisker plots displaying the medians, interquartile ranges (boxes) and minima and maxima (whiskers) (i–n, n = 5). P > 0.05, not significant (ns); *P < 0.05; **P < 0.01; ****P < 0.0001

