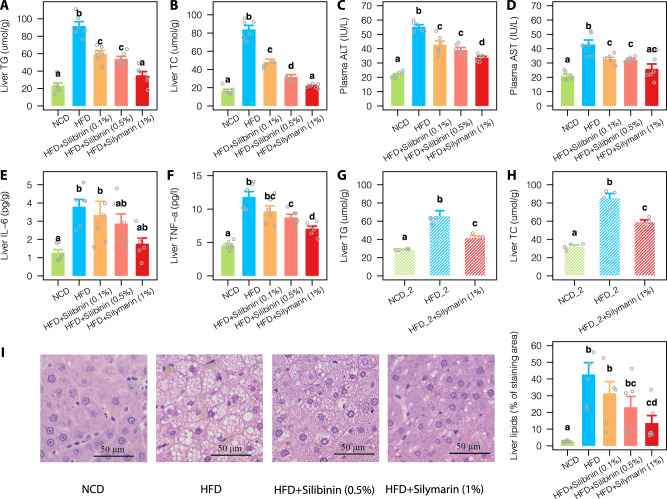
Fig. 1. Improvement of liver lipid metabolism in rats upon silymarin/silibinin treatment for 12 weeks.
Levels of liver TG (A) and TC (B); levels of plasma ALT (C) and AST (D); and levels of liver IL-6 (E) and TNF-α (F) in all five treatment groups. Changes of Liver TG (G) and TC (H) from a second replicate experiment. I Representative microphotograph of hematoxylin and eosin (H&E) staining and quantification of liver lipids. Values were shown as mean ± S.E.M. Groups labeled with different letters (a, b, c, or d) indicate significant statistical differences (FDR adjusted P < 0.05; two-sided Wilcox rank-sum test). Six rats were included in each group. Scale bar: 50 μm. NCD normal chow diet, HFD high fat diet, ALT alanine transaminase, AST aspartate aminotransferase, TG triglycerides, TC total cholesterol, IL-6 interleukin 6, TNF-α tumor necrosis factor alpha. Source data are provided as a Source data file.

