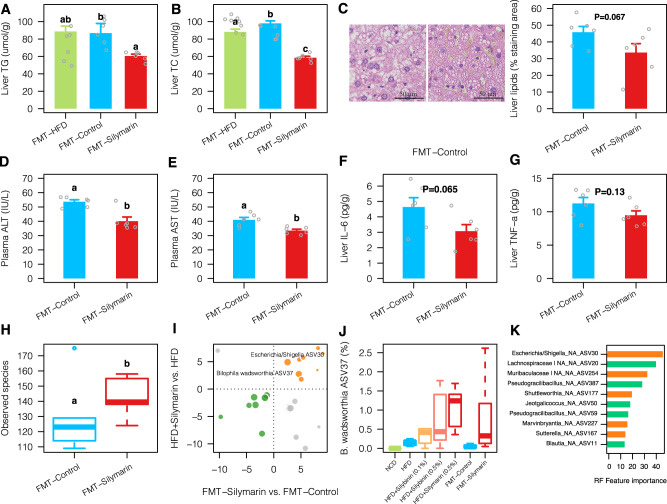
Fig. 3. Liver lipids and associated gut microbiota changes after fecal microbiota transplantation (FMT) to rats fed on high-fat diet for 12 weeks.
Levels of liver TG (A) and TC (B) together with representative microphotograph of hematoxylin and eosin (H&E) staining (C); levels of plasma ALT (D) and AST (E); and levels of liver IL-6 (F) and TNF-α (G) after FMT for 12 weeks using fecal samples collected from silymarin-treated rats with (FMT-control) or without heat-killing (FMT-Silymarin). Two-sided Wilcox rank-sum test was used to access the group differences; groups labeled with different letters (a, b, or c) indicate significant statistical differences (FDR adjusted P < 0.05). For bar plots, values were shown as mean ± S.E.M. H The differences of alpha diversity in FMT-Control vs. FMT-Silymarin (one outlier within the FMT-Control group as shown in the boxplot was removed for the statistical analysis). I The log2 fold changes of amplicon sequence variations (ASVs) that were significantly changed in both HFD + Silymatrin vs. HFD and FMT-Silymarin vs. FMT-control groups; the dot sizes were proportional to their prevalence among samples; dots colored in yellow and green indicate consistently increased and decreased ASVs, respectively. J Changes in the relative abundance of B. wadsworthia in all treatment groups. K The top 10 ASVs that contribute to most to the variations of liver TG as assessed by random forest regression based on all groups of rats (orange and green colors indicate increased and decreased abundance upon silymarin treatment, respectively). Six rats were included in each group. Scale bar: 50 μm. ALT alanine transaminase, AST aspartate aminotransferase, TG triglycerides, TC total cholesterol, IL-6 interleukin 6, TNF-α tumor necrosis factor alpha. Source data are provided as a Source data file.

