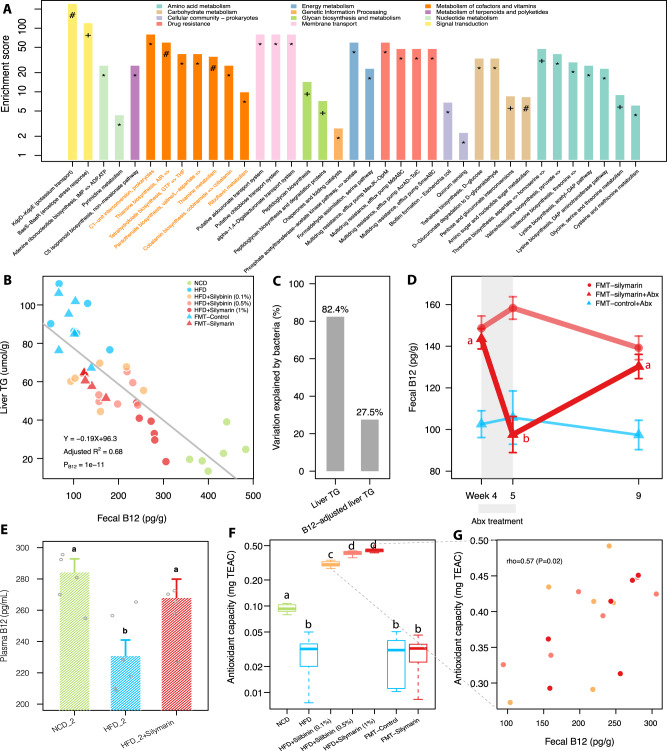
Fig. 4. Microbial functional alternations upon silymarin treatment.
A Pathway enrichment analysis for those 110 KOs that were mostly (spearman correlation coefficient rho ≥0.9 or ≤−0.9) associated with liver TG; hypergeometric test was used for analysis (*, +, and # indicate adjusted P < 0.05, 0.01, and 0.001, respectively). B Linear regression analysis between fecal B12 concentrations and liver TG levels. C Bar plot showing the variations of raw liver TG and liver TG adjusted for fecal B12 explained by the gut bacteria based on random forest regression; the levels of liver TG adjusted for B12 were measured by the residuals calculated from the linear regression between liver TG and fecal B12 in panel (B). D The longitudinal changes of fecal B12 during fecal microbiota transplantation (FMT) with or without antibiotic (Abx) treatment during weeks 4 to 5; the gut microbes transferred in the FMT-Control group were heat-killed. E Levels of plasma B12 in the replication experiment. F The fecal antioxidant capacities as measured by trolox equivalent antioxidant capacity (TEAC) assay in different treatment groups. G The correlation between the fecal B12 and antioxidant capacities in three groups of mice on HFD. Six rats were included in each group. Two-sided Wilcox rank-sum test was used in panels (D–F) to obtain the significance levels; groups labeled with different letters (a, b, or c) indicate significant statistical differences. For bar plots, values were shown as mean ± S.E.M. NCD normal chow diet, HFD high fat diet, TG triglycerides. Source data are provided as a Source data file.

