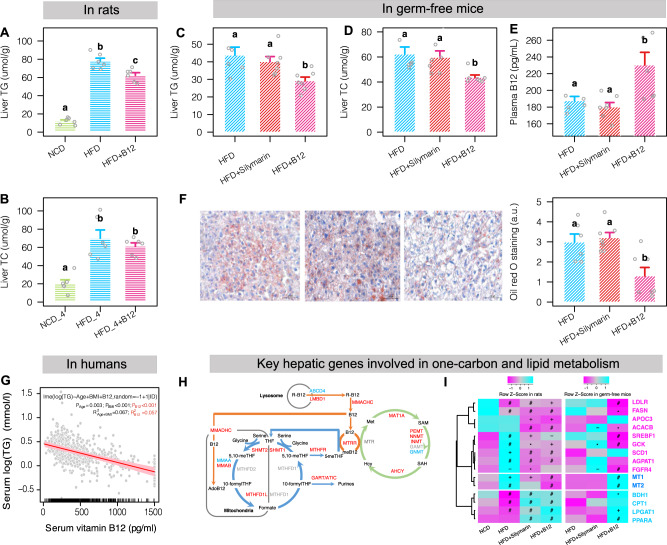
Fig. 5. Levels of liver lipids in rats and germ-free mice supplemented with or without B12 and association of plasma TG and B12 in humans.
Levels of liver TG (A) and TC (B) in rats supplemented with or without B12 in the diet (n = 6 for each group). Two-sided Wilcox rank-sum test; groups labeled with different letters (a, b, or c) indicate significant statistical differences. Levels of liver TG (C) and TC (D) and plasma B12 (E) in germ-free mice (n = 7, 8, and 7 for the HFD, HFD + silymarin, and HFD + B12 treated groups, respectively). F Oil Red O staining of liver lipid droplets in germ-free mice (n = 6, 7, and 6 for the HFD, HFD + silymarin, and HFD + B12 treated groups, respectively; FDR adjusted P value = 0.032 and 0.080 for HFD + B12 versus HFD + Silymarin and HFD groups, respectively). G Association between the levels of serum vitamin B12 and triglycerides in 398 responders using linear mixed effect model. H Rat liver transcriptome analyses revealing the upregulation of key genes involved the one-carbon metabolism mediated by folate, B12, and the methionine cycles. I Regulation of key hepatic genes involved in lipogenesis and fatty acid oxidation in rats and in germ-free mice by silymarin or B12 (−, *, +, and # indicate P values smaller than 0.1, 0.05, 0.01, and 0.001, respectively). Wald test implanted in DESeq2 package was used for identification of differentially expressed genes and hypergeometric test was used for pathway enrichment analysis. For bar plots, values were shown as mean ± S.E.M. Scale bar: 50 μm. NCD normal chow diet, HFD high fat diet, TG, triglycerides, TC total cholesterol. Source data are provided as a Source data file.

