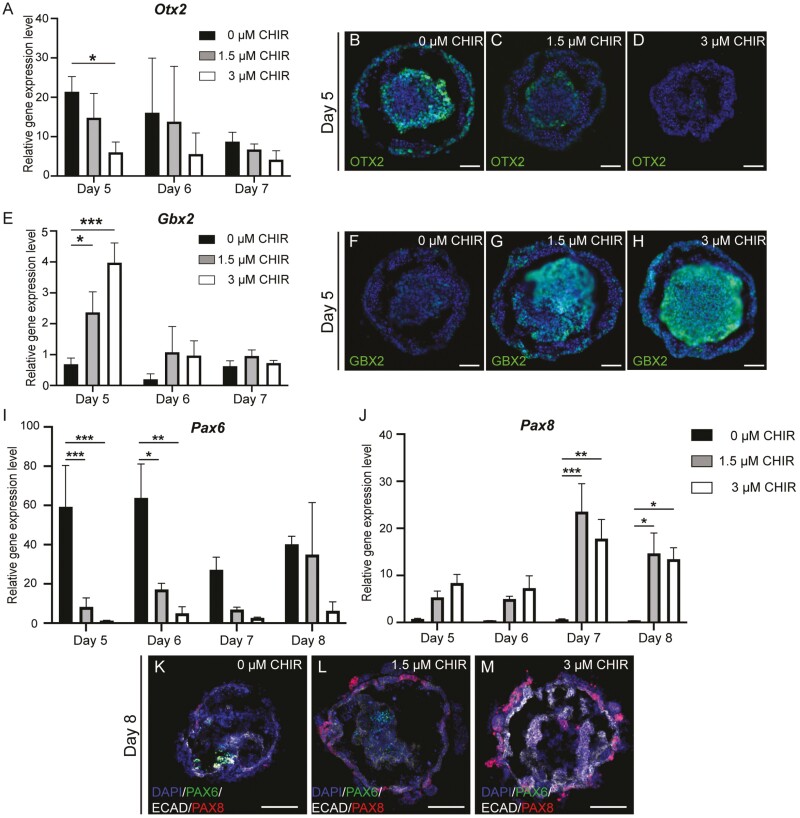
Figure 2.
Wnt modulation regulates the presence of anterior and posterior placodal cells during inner ear organoid induction. Mean (±SD) gene expression and representative IHC images of an anterior marker, Otx2 (A-D), and a posterior marker, Gbx2 (E-H), under various Wnt levels during early inner ear organoid induction. Mean (±SD) gene expression levels of the aPPE marker Pax6 (I) and the pPPE marker Pax8 (J) in samples undergoing various Wnt modulation levels. (K-M) Representative IHC images of PAX6, E-cadherin (ECAD), and PAX8 in D8 samples under various degrees of Wnt modulation. Scale bar=50 µm. n = 3-6 independent differentiation experiments. *, **, and *** denote P < .05, <.001, and <.0001, respectively, and there were significant effects (2-way ANOVA) of day (***) and treatment (***).

