Figure 5.
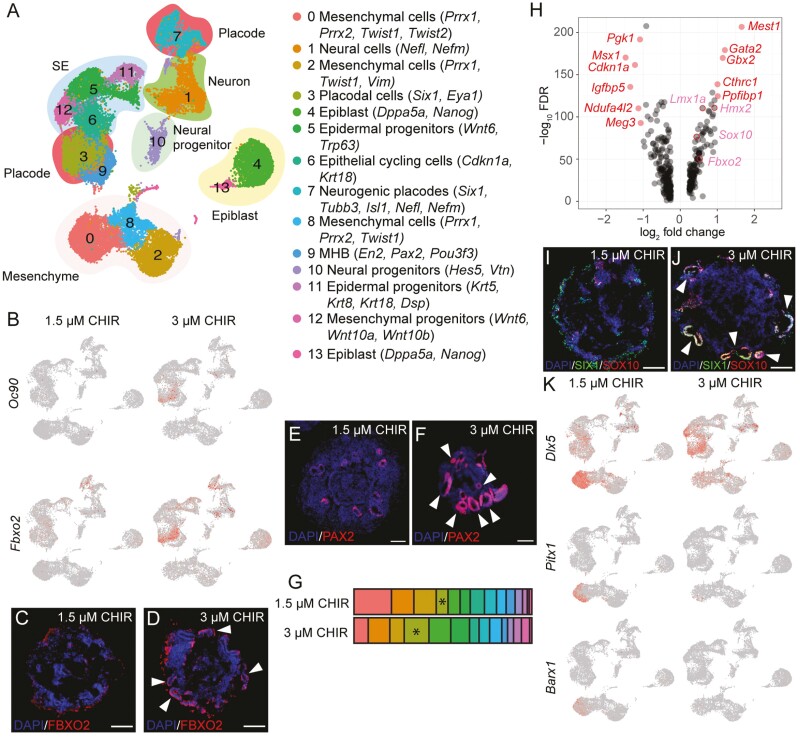
A caudal microenvironment in aggregates is required for otic placode induction from the pPPE. (A) UMAP of D10 samples in 1.5 and 3 µM CHIR treatments featuring 14 annotated clusters. (B) Expression of 2 otic placodal markers, Oc90 and Fbxo2, in 3 µM CHIR samples. Representative IHC images of D10 OV staining with FBXO2 (C-D) and PAX2 (E-F). (G) Differential distribution of cells between the 1.5 and 3 µM CHIR treatments. Asterisks indicate cluster 3 (placodal cluster). (H) Volcano plot of differential gene expression in cluster 3 between 1.5 and 3 µM CHIR samples on D10. DEGs (average log2 fold change>1) are labeled in red, and pink labels indicate upregulated otic genes (log2 fold change<1) in 3 µM samples. (I-J) Representative IHC images of D10 OV staining with the placodal marker SIX1 and the otic marker SOX10. (K) Decreased expression of the rostral oral markers Dlx5, Pitx1, and Barx1 in the mesenchymal cluster of the 3 µM CHIR samples. White arrowheads indicate OVs. Scale bars = 50 µm.

