Figure 6.
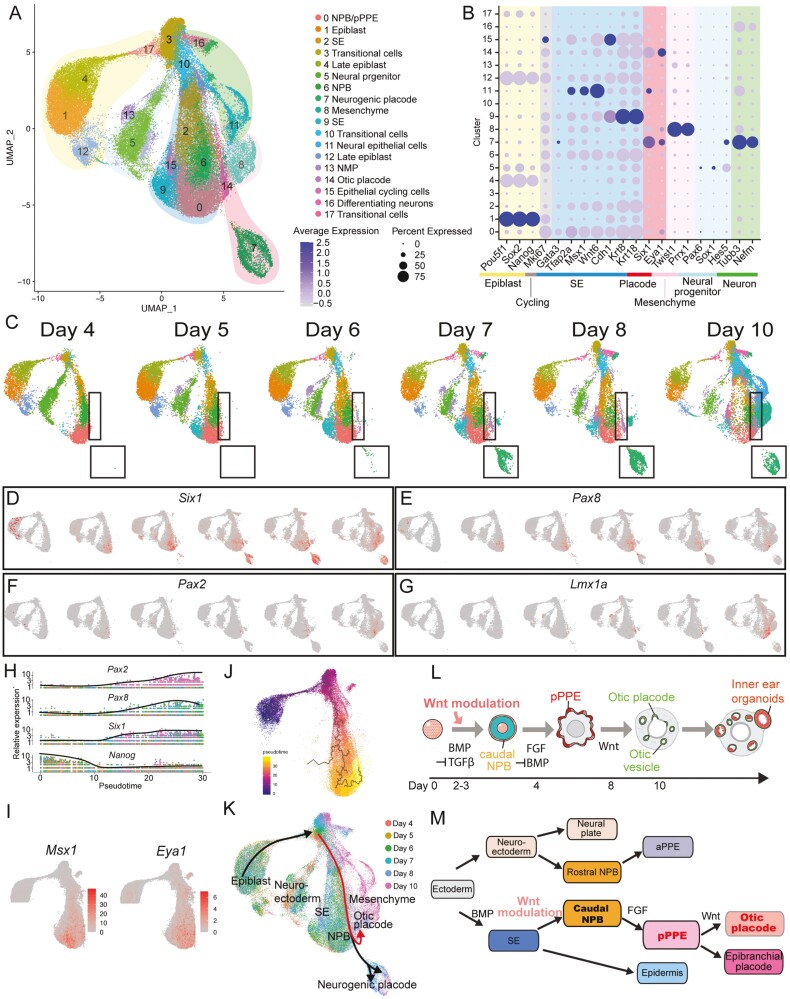
Wnt modulation drives the development of the otic placode from the caudal neural plate border (NPB) to the posterior PPE (pPPE). (A) UMAP visualization of 3 µM CHIR samples across induction days (D4 through D10). (B) Dot plot of marker genes of different lineages. (C) Feature plots of samples from each induction day demonstrating that cell composition shifted over time. The black boxes indicate the placodal clusters. The expression of critical otic lineage genes Six1 (D), Pax8 (E), Pax2 (F), and Lmx1a (G) across induction days. (H) Kinetic plot showing relative gene expression levels of otic placode and pluripotency (Nanog) markers across developmental pseudotime. (I) The expression of select genes associated with the NBP (Msx1) and PPE (Eya1). (J) Trajectory of the otic lineage colored by inferred pseudotime. (K) Putative placodal trajectories (black lines with arrowheads). The red lines indicate the otic trajectory. Schematics of inner ear organoid induction (L) and hypothetical ectodermal cell differentiation (M).

