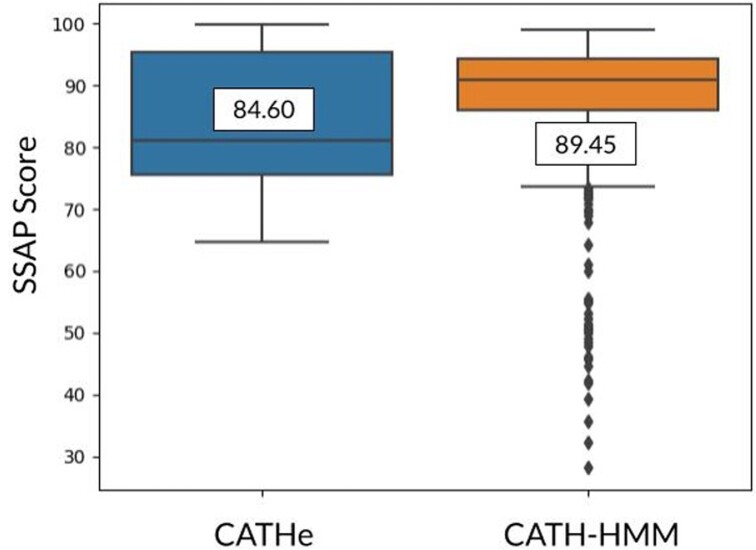
Fig. 4.
Comparison of SSAP scores for superfamily predictions made by the CATH-HMMs for Gene3D domains from H.sapiens (orange box) and CATHe for Pfam domains from H.sapiens (blue box). The SSAP boxplots for both of these sets have been annotated with their average SSAP score. The CATH-HMM set had a greater average SSAP score than the Pfam-human set showing that they tend to be closer homologues to the existing CATH superfamily relatives than those detected by CATHe

