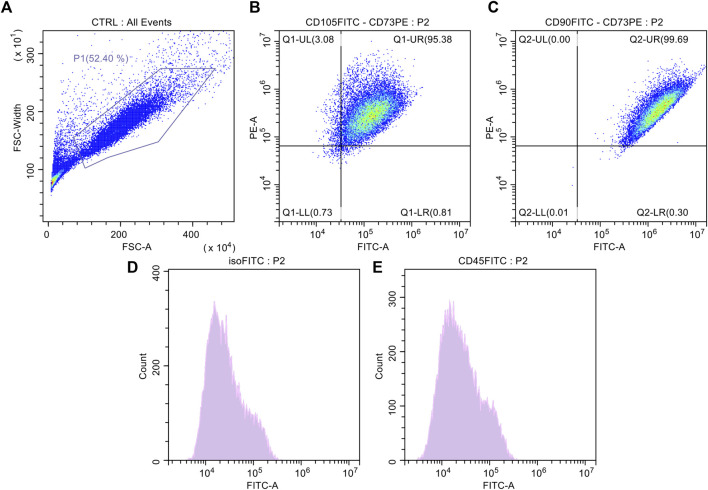
FIGURE 4.
Surface antigen expressions of culture expanded adipose-derived stromal cells (ASCs). (A) Control cell population; (B) Dot plot of culture expanded ASCs marked with FITC-CD105 and PE-CD73; (C) Dot-plot of culture expanded ASCs marked with FITC-CD90 and PE-CD73; (D) Histogram of culture expanded ASCs marked with FITC-Isotype Control; (E) Histogram of culture expanded ASCs marked with CD45-FITC.

