Figure 2.

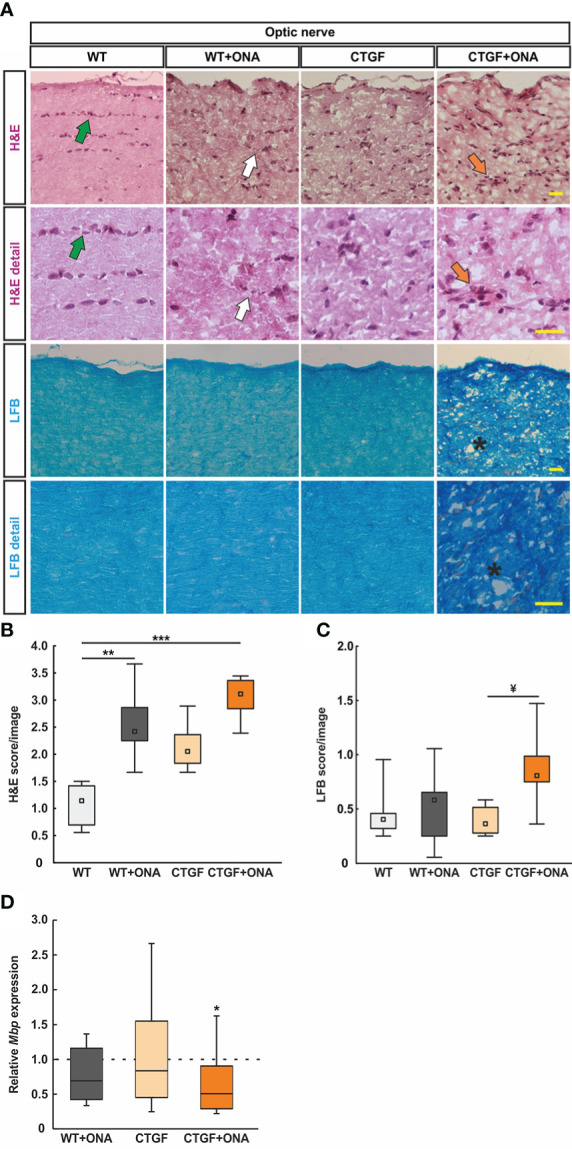
Enhanced optic nerve degeneration. (A) Longitudinal optic nerve sections were stained with H&E (cellular inflammation) and LFB (demyelination) and are shown as overview and in detail. In the H&E staining, healthy optic nerves show a linear formation of the nuclei (green arrows), which is disrupted in glaucomatous optic nerves (white arrows) and might comprise cellular conglomerates (orange arrows). LFB stained myelin sheats in healthy optic nerves resembles combed bundles in a parallel arrangement, which is interrupted in CTGF+ONA optic nerves (stars). (B) The H&E score revealed a higher degree of cellular inflammation in WT+ONA and CTGF+ONA animals compared to WT. (C) The LFB score showed a disruption of myelin in CTGF+ONA optic nerves compared to CTGF animals. (D) The mRNA expression levels of Mbp were significantly downregulated in CTGF+ONA optic nerves compared to controls. Values are median +/- interquartile range +/- range for histology and median ± quartile ± minimum/maximum for RT-qPCR. The dotted line in (D) represents the relative expression of the WT group. *p<0.05, **p<0.01 and ***p<0.001 vs. WT; and ¥p<0.05 vs. CTGF. Scale bars: 20 µm.
