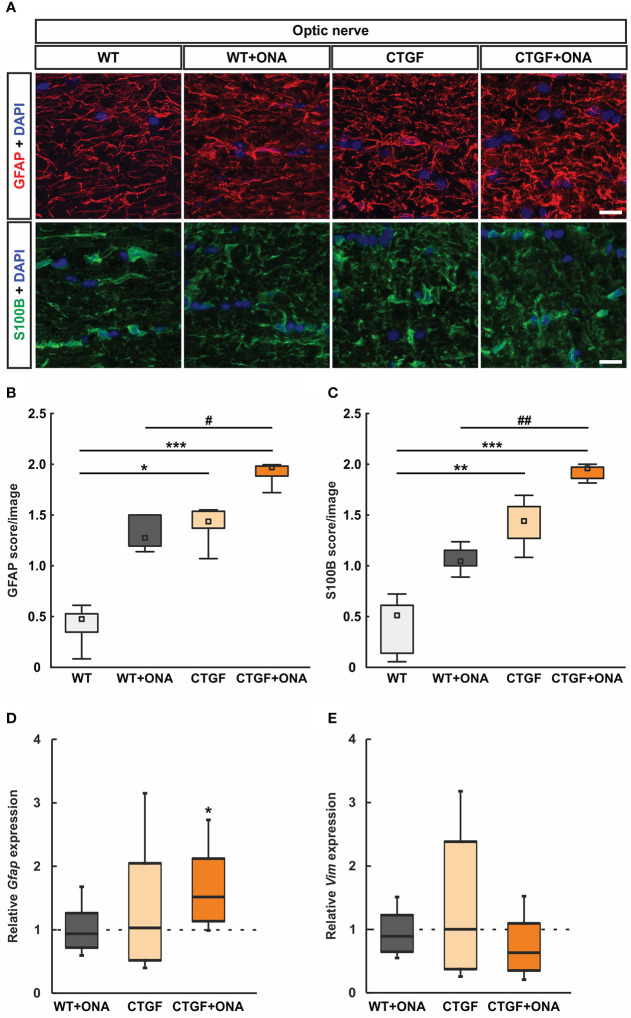
Figure 4.
Increased astrogliosis in CTGF+ONA optic nerves. (A) Longitudinal optic nerve sections were stained with antibodies against anti-GFAP (red) and anti-S100B (green) to label astrocytes. DAPI was used to counterstain cell nuclei (blue). (B) The GFAP score was not altered in WT+ONA optic nerves compared to WT. A higher score was revealed in CTGF and CTGF+ONA optic nerves compared WT. The GFAP score in CTGF+ONA animals was also significantly higher than in WT+ONA mice. (C) In WT+ONA animals, the S100B score was not different when compared to WT optic nerves. A significantly higher S100B score was revealed in CTGF and CTGF+ONA optic nerves compared to WT. The S100B score of CTGF+ONA animals was significantly higher than in WT+ONA optic nerves. (D) The mRNA expression levels of Gfap were not altered in WT+ONA and CTGF mice. In contrast, a significant upregulation was noted in CTGF+ONA optic nerves. (E) The mRNA expression levels of Vim were similar in all groups. Values are median +/- interquartile range +/- range for histology and median ± quartile ± minimum/maximum for RT-qPCR. The dotted lines in (D, E) represent the relative expression of the WT group. *p<0.05, **p<0.01, and ***p<0.001 vs. WT; #p<0.05 and ##p<0.01 vs. WT+ONA. Scale bars: 20 µm.

