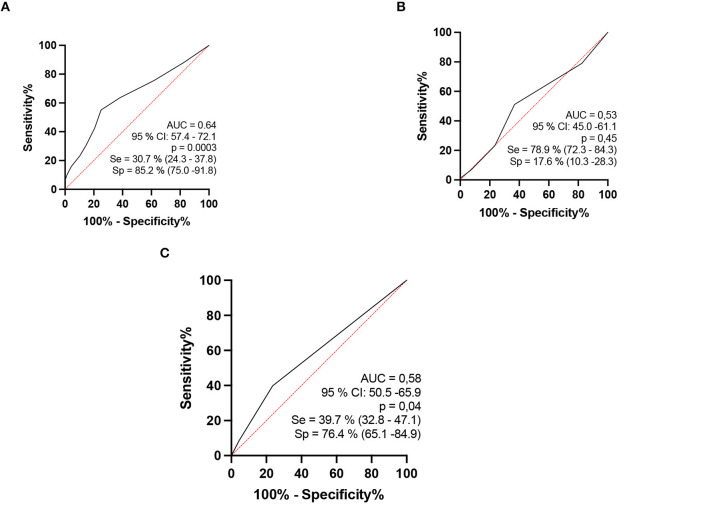
Figure 7.
Analysis by the ROC curve comparing HHC and patients with HD aged 15–60 years: percentage indices of altered nerves among the nerves evaluated per individual [(A) up on the right]. The percentage indices of the number of asymmetries (ΔCSA) [(B) up on the left]. The percentage indices of the number of focalities (ΔTpT) [(C) as mentioned later].

