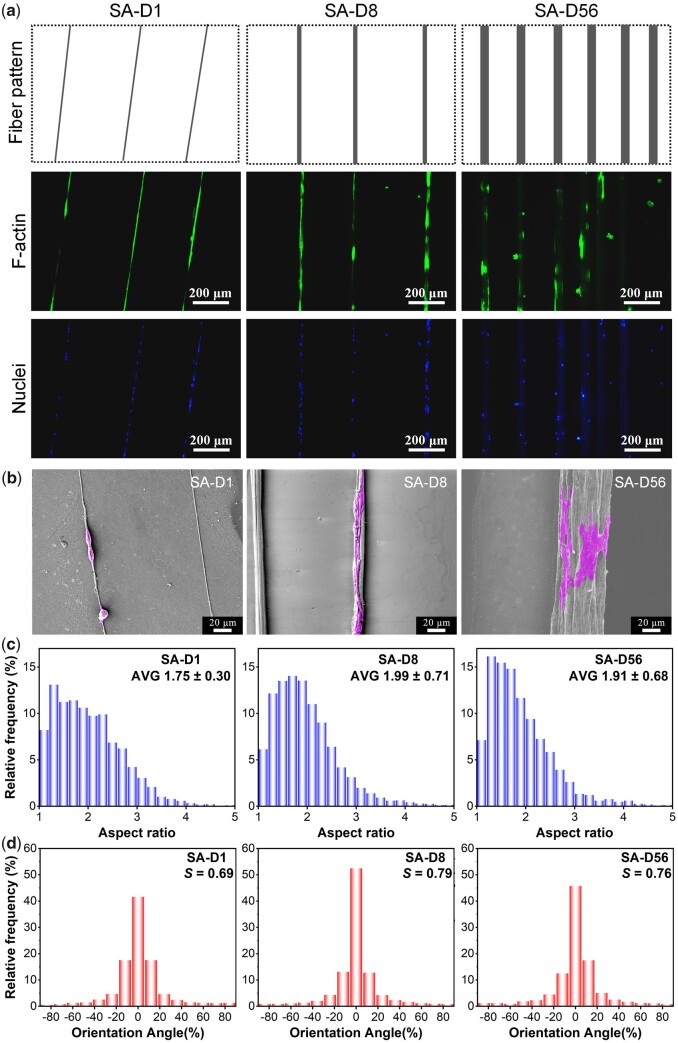
Figure 3.
Adhesion of bMSCs on the SA fiber patterns with different fiber diameters after 12 h of culture. (a) Fluorescence micrographs of the cells and corresponding cartoon presentation of the fiber patterns. (b) SEM micrographs. (c) Statistical results of the aspect ratio distribution of cells. The data of the histograms came from the nuclear aspect ratio of bMSCs. Data on the top-right corner represents mean ± SD of the aspect ratio. (d) Statistical results of the orientation angle distribution of cells. The data of the histograms came from the nuclear orientation of bMSCs, and the zero angles were defined along the fiber direction; S refers to the order parameter of cell orientation.

