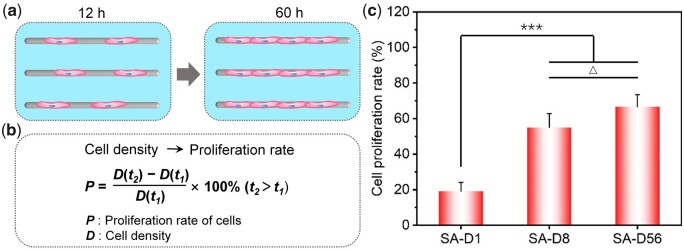
Figure 4.
Proliferation of bMSCs on the SA fiber patterns after 60 h of culture. (a) Cartoon presentation to illustrate the proliferation of cells. (b) Schematic presentation of the calculation of cell proliferation rate from the change of cell density (D, cell number divided by the total adhesive area of corresponding fibers). (c) Statistical results of the cell proliferation rate. ‘***’: P < 0.001, ‘Δ’: P > 0.05.

