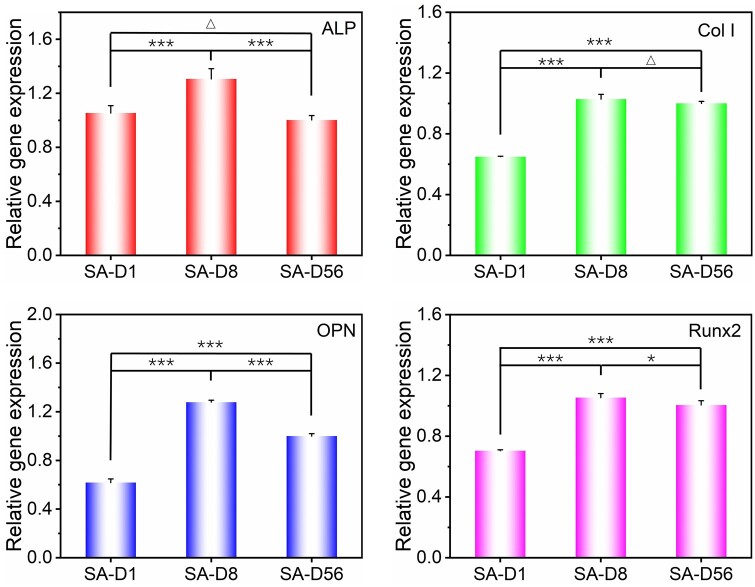
Figure 5.
Statistical results of relative osteogenic specific genes (ALP, Col I, OPN, Runx2) expression of bMSCs on the SA fiber patterns with different diameters after 4-day of culture. For each gene, the expression level was normalized to the group of SA-D56. ‘*’: 0.01 < P < 0.05, ‘***’: P < 0.001, ‘Δ’: P > 0.05.

