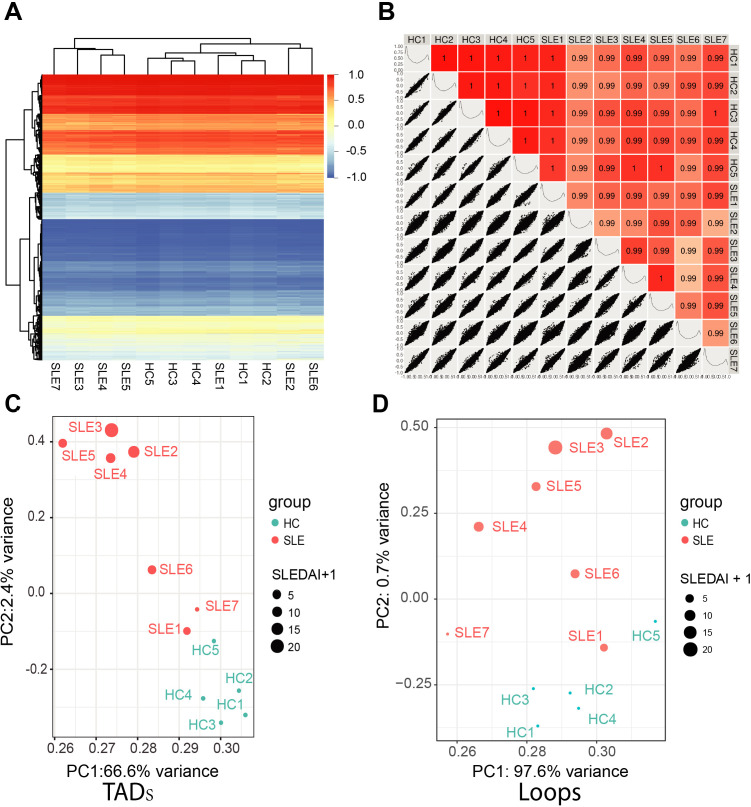
Figure 1.
Genomic three-dimensional feature difference of CD4+ T cell between patients with systemic lupus erythematosus (SLE) and healthy controls (HCs). (A) Compartments of 12 samples including 7 patients with SLE and 5 HCs. Compartment c score from −1 to 1 are shown with blue to red. (B) Pairwise Pearson’s correlation coefficient and associated scatter plots between each two samples. The upper right displays Pearson’s correlation coefficient. The scores are shown in different degrees of red. The lower left displays scatter plots of compartments c score between each two samples. The c score distributions of each sample are shown on diagonal. (C–D) Principal component analysis of the topologically associated domains (TADs) border appearance (C) and the loop strength (D) of the 12 samples. Patients with SLE are shown as red points and HCs are shown as blue points. The point size reflects the SLE Disease Activity Index (SLEDAI) of patients and we set SLEDAI of HCs as 0.

