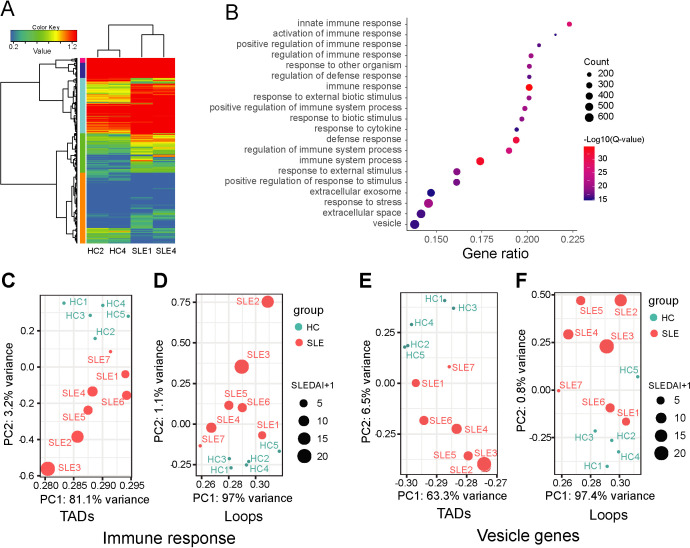
Figure 2.
Gene expression difference between patients with systemic lupus erythematosus (SLE) and healthy controls (HCs). (A) Heat map represent differentially expressed genes (DEGs) between patients with SLE (SLE1, SLE4) and HCs (HC2, HC4). (B) Gene Ontology (GO) functional enrichment of the DEGs. (C–F) Principal component analysis of the topologically associated domains (TADs) border appearance and loop strength from which the TADs and loops overlap with genes from DEGs and annotated as GO function ‘immune response’ and ‘vesicle genes’. SLEDAI, SLE Disease Activity Index.

