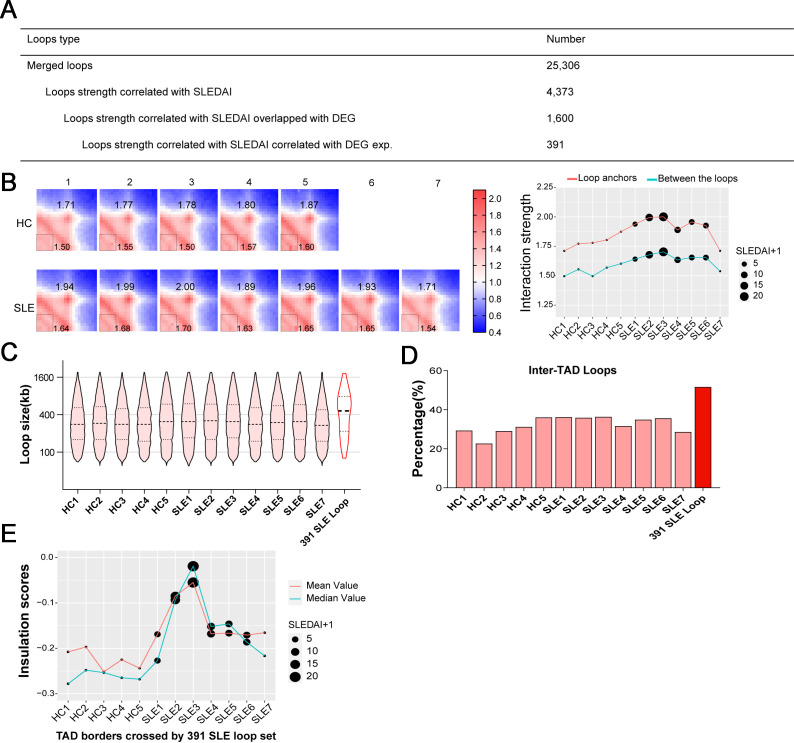
Figure 3.
Systemic lupus erythematosus (SLE) associated loops are identified by SLE Disease Activity Index (SLEDAI) scores and different gene expression. (A) Number of loops that correlated with SLEDAI scores and gene expression. (B) Aggregate peak analysis result on 391 SLE loops that associated with SLEDAI scores and differentially expressed genes (DEGs) expression in each sample. With normalised APA matrix (left), interaction strengths are indicated at central pixel (loop anchors) and the lower left pixels (between the loop anchors). SLEDAI are indicated in line plot (right). (C) Length distribution of loops in all the samples and 391 SLE loops. (D) Percentages of intertopologically associated domain (inter-TAD) loops in all the samples and 391 SLE loops. (E) The mean value and median value of insulation scores from the TAD border. In each sample, the TAD border that are crossed by 391 SLE-associated loops are selected. SLEDAI are indicated in all samples. HC, healthy control.

