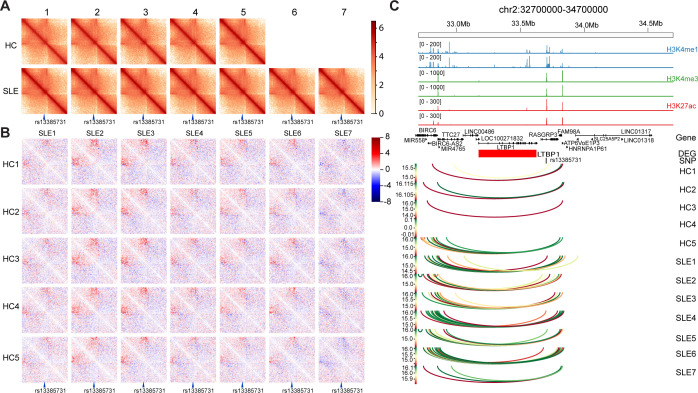
Figure 5.
Long-term interactions change at systemic lupus erythematosus (SLE) risk single-nucleotide polymorphism (SNP) rs13385731 between patients with SLE and healthy controls (HCs). (A) Chromatin interaction map of rs13385731 localised region of all the samples. rs13385731 is indicated at the bottom. (B) Difference in chromatin interaction map of rs13385731 localised region. The 20 kb binned heatmap depicting the Z-score difference between HCs (different rows) and patients with SLE (different columns) are shown. rs13385731 is indicated at the bottom. Long-term interaction enhanced in sample SLE1, SLE2, SLE3, SLE4, SLE5, SLE6 compared with HC1~HC5 could be viewed. (C) Genomic features of localised region of rs13385731. From the top, genomic coordinates, ChIP-seq peaks of H3K4me1, H3K4me3 and H3K27ac in activate CD4+ T cell from public data, gene location, gene expression difference between patients with SLE and HCs. Red means upregulation in SLE sample, blue means downregulation in SLE sample. The colour reflects the log base 10 of interaction’s p value. DEG, differentially expressed gene.

