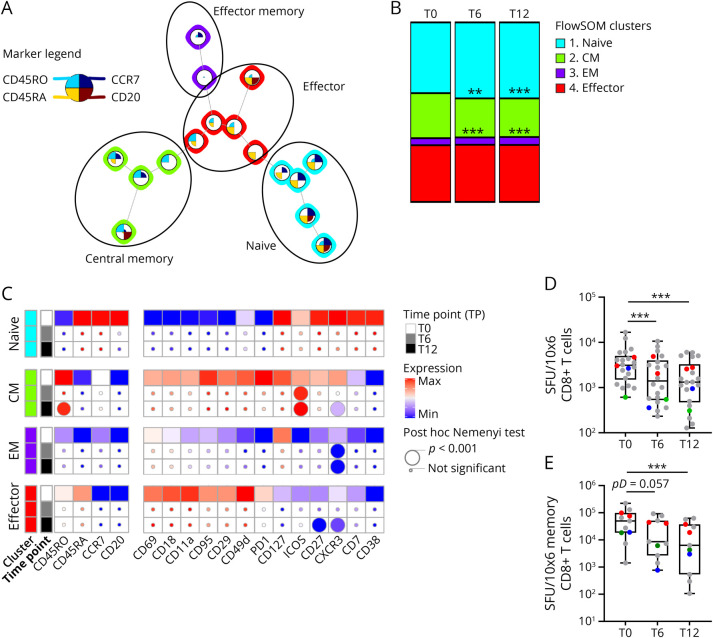
Figure 4. Loss of Functional Activated Central Memory CD8+ T Cells on OCRE Treatment.
(A) FlowSOM unsupervised subclustering of PBMC CD8+ metacluster 5 discriminates the circulating naive, central memory (CM), effector memory (EM), and effector (Eff) CD8+ T cells (see legend for marker selection and submetacluster definition). (B) Modification in the frequency of FlowSOM unsupervised naive and memory CD8+ T-cell subsets overtime (T0, T6, and T12) is represented. The asterisks (*) represent significant differences for the effect of time for a given treatment on a given metacluster: **p < 0.01; ***p < 0.001 using a nonparametric paired post hoc Nemenyi test. (C) Statistical heatmap analyses of markers of phenotype, function/activation, and CNS-migration properties of CD8+ cell subsets overtime (T0, T6, and T12). Effect of the treatment overtime and over CD8+submetaclusters was tested using a nonparametric paired Friedman test as compared to baseline (T0, squares). If significant, a nonparametric paired post hoc Nemenyi test was run to compare baseline values with subsequent time points (T0 vs T6 and T0 vs T12). Post hoc results are depicted as circles (the smallest being not significant; the lower intermediate, p < 0.05; the upper intermediate, p < 0.01; and the largest, p < 0.001, see the figure for details). (D) IFN-γ–mediated cellular immune responses against a pool of immunodominant peptides of CMV, EBV, and influenza (CEF) were tested using an ELISPOT assay at 3 time points of OCRE administration (T0, T6, and T12) in n = 22 of 38 patients tested with valid ELISPOT at T0 and more than 4 times the unstimulated condition. Spot-forming units (SFUs) were normalized to total CD8+ T-cell counts (frequencies from cluster 5, Figure 1, B and C). (E) In a subset of patients tested in panel D (11/22), CD8+ T-cell fractions were MACS sorted at 3 time points of OCRE administration (T0, T6, and T12) and cocultured with autologous CD8-depleted PBMCs (CD80−) that were collected only at T0, at a ratio of 1:10 (CD8+:CD80−). SFUs were normalized to total memory CD8+ T-cell counts (frequencies from clusters 2 and 3, panel A). (D-E) The asterisks (*) represent significant differences for the effect of time: ***p < 0.001 using a nonparametric paired Friedman test followed by a post hoc Dunn test (pD). Colored dots represent patients who developed infections on OCRE treatment over the period of the study. In green, patients previously under IFN; in red, previously under DMF; and in blue, previously under GA. ELISPOT = enzyme-linked immunospot; MACS = magnetic-activated cell sorting; OCRE = ocrelizumab; PBMCs = peripheral blood mononuclear cells.

