
Figure 6:
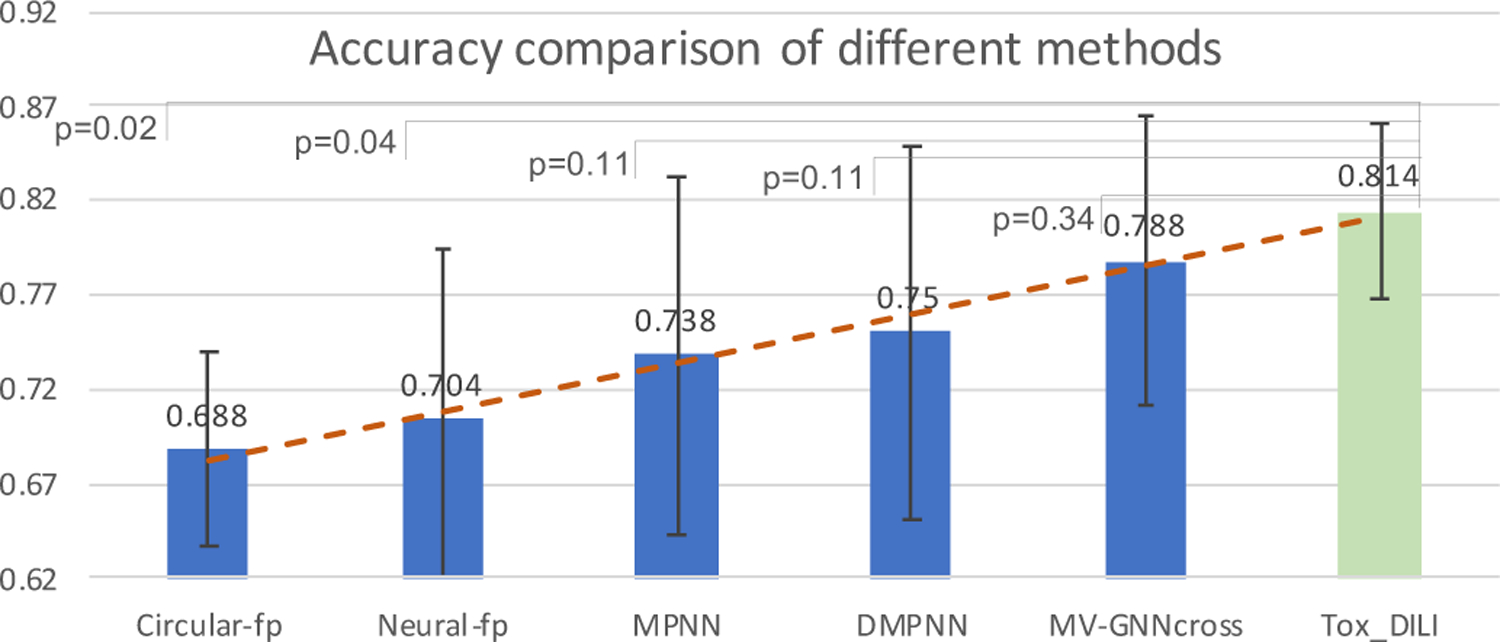
Performance comparison on accuracy of different methods using cross-validation with random splitting (higher is better). Light green color indicates our proposed method. P indicates the p-value calculated from the Wilcoxon test between our proposed method and other baselines.